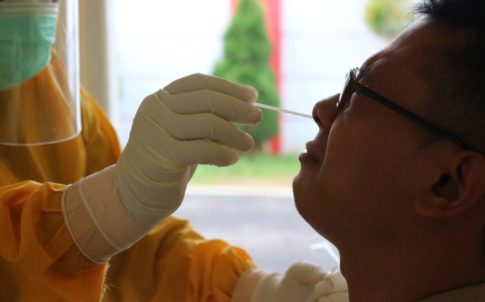
Launched on December 18, 2020, the UNC Gillings COVID-19 Dashboard provides a centralized resource center for information about COVID-19 in North Carolina. Using modern epidemiologic tools, the dashboard has become a resource for policy makers, researchers and anyone interested in learning more about COVID-19 in the state.
The dashboard also provides county-level profiles and interactive COVID-19 data visualizations for North Carolina, allowing users to see what’s happening in their area of the state by mapping demographics, health outcomes, economic characteristics and more.
Carolina Demography worked closely with the core project team to provide data and maps for the dashboard so that visitors to the dashboard can see salient COVID-19 statistics and relevant county context in one place.
Our work for this project involved data acquisition, cleaning, and integration – and drew on our deep knowledge of contextual datasets.
We used population estimates for local context (age, race, ethnicity), covariates related to county health, and county economic indicators, along with data from multiple state agencies to process multiple contextual data sets. These data sets were given to researchers for use in interactives on the site. In addition, we made GIS maps (shapefiles) for use in interactives on the website, including mapping data for nursing homes, meatpacking plants, colleges and universities, and child care facilities and schools.
Throughout the project, we assisted the research team in developing and revising multiple interactives by responding to first drafts, providing feedback on data elements incorporated, and revising language/framing.
The data visualizations on https://gillingscovid19.unc.edu/ help communicate layers of context around COVID-19. Visitors can also see relevant COVID-19 statistics and relevant county context in one place.
Penny Gordon-Larsen, the Associate Dean for Research at the UNC Gillings School of Global Public Health, noted the fine work Carolina Demography produced. “I can’t tell you how impressed I am with these folks,” she wrote. “They certainly went over and above and I am so appreciative of all that they did. They were incredible to work with and their work was (as expected) top notch.”
UNC Gillings School of Global Public Health
To help people better understand COVID-19's spread in NC

January is National Human Trafficking Prevention Month. Human and labor trafficking is an evolving crisis that operates in the shadows of the major interstates and rural farmlands in North Carolina. The US Department of Justice defines human trafficking as a crime…
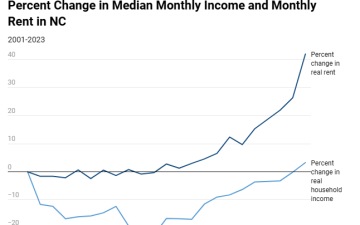
This blog post expands on a previous blog post that examined housing cost burden across NC by focusing on the disparities between housing cost burden for homeowners and renters. In North Carolina, 66.8% of occupied housing units are owner-occupied, while…
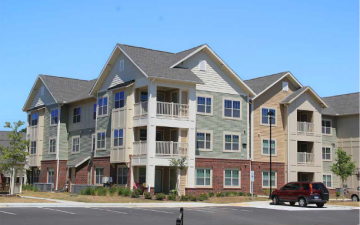
In recent years, housing has become a hot-button issue both nationwide and in our state, as many people struggle to find secure, affordable housing options. David Rouse, Ben Hitchings, and Anita Brown-Graham of the UNC School of Government’s ncIMPACT Initiative…
Your support is critical to our mission of measuring, understanding, and predicting population change and its impact. Donate to Carolina Demography today.