This blog post expands on a previous blog post that examined housing cost burden across NC by focusing on the disparities between housing cost burden for homeowners and renters.
In North Carolina, 66.8% of occupied housing units are owner-occupied, while 33.2% are renter occupied.
According to Harvard’s Joint Center for Housing Studies’ 2025 report, nationwide, rental demands have been steadily increasing in recent years. Rental demand is especially pronounced among people aged 35-44 (prime first-time home buying ages) and those over 65. A major factor in this change in demand is rising homeownership costs, however rental costs have also increased substantially alongside homeownership costs.
Renters experience far higher rates of housing cost burden in North Carolina, with 45.2% of rented units classified as housing cost burdened compared to 11.1% of owned units
County level data also consistently show renters experiencing higher rates of housing cost burden, with the highest levels of renter-occupied housing cost burden is in Watauga County, where over half (56.0%) of rented units are housing cost burdened. The lowest renter-occupied housing cost burden rate is in Gates County, at 15.0%. Housing cost burden for owned units ranges from 6.6% in Jackson County to 21.5% in Bertie County.
Housing cost burden for renters, like overall cost burden, is more concentrated in the eastern part of the state, while housing cost burden for owners is more uniformly spread across North Carolina.
Housing cost burden for renters and owners do not always go hand in hand; Guilford, Alamance, Orange, Durham, and Wake counties all have some of the highest levels of housing cost burden for renters in the state (around 40%-50%) and some of the lowest levels of owned housing cost burden (around 8%-10%). Buncombe and Mecklenburg counties similarly have relatively high housing cost burden rates for renters and low housing cost burden rates for owners. These counties with large disparities between renters and owners in housing cost burden rates contain some of the state’s largest urban centers.
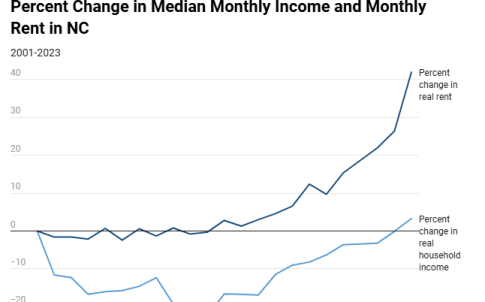
Perhaps the biggest reason housing cost burden has become such a pervasive issue across the US and North Carolina is that rent prices have skyrocketed while real wages have largely stagnated. When we say “real” rents and wages, it simply means that we are adjusting for inflation. With this in mind, from 2001 to 2023, real rents in North Carolina have increased by 42.0%, while real household incomes of renters have increased by only 3.3%. Harvard’s JCHS found a similar disparity between the increases in rents and wages nationwide, with real rents increasing by 21% and real household incomes increasing by 2%. However, North Carolina’s real median rent increased by much more than nationwide rents, while NC’s real median income change is similar to the nationwide trend.
Since the increase in rent is far outpacing increases in household incomes, rent is likely to consume a higher proportion of household expenditures, leading to a higher likelihood of housing cost burden.
Since housing cost burden is based on income level, how much would a full-time worker need to earn to not be housing cost burdened? The Department of Housing and Urban Development (HUD) releases Fair Market Rent (FMR) estimates for US counties, which were used to calculate the minimum non-housing cost burdened hourly wage. FMRs are “estimates of 40th percentile gross rents for standard quality units” and include utility payments. The minimum hourly wage calculation assumed 40-hour work weeks for 52 weeks per year and a 2-bedroom housing unit at fair market rent, which is the HUD standard.
This minimum wage calculation does not include owner-occupied units. However, as previously demonstrated, renters are far more likely to experience housing cost burden. The National Association of Realtors publishes median monthly mortgages by county. This data does not include other owner-occupied housing costs but could be used for further analysis.
The current state-wide minimum wage in North Carolina is $7.25 per hour. In counties with the lowest non-housing cost burdened minimum hourly wage, the calculated wage is more than double the current NC minimum wage. The lowest non-housing cost burdened minimum hourly wage is $14.83, and the maximum is $28.19, which is almost four times as much as the current minimum hourly wage. The highest non-housing cost burdened minimum hourly wages are in counties surrounding large urban centers — Raleigh, Charlotte, and Asheville — and in Currituck County.
Housing cost burden is a key component to understanding and addressing the housing crisis in North Carolina and provides valuable insights into who is most affected by housing unaffordability, specifically by county and home ownership status. The minimum non-housing cost burdened hourly wage can also act as a policy tool to help alleviate the housing crisis for North Carolinians. Yet, housing cost burden is only part of the picture. More research needs to be conducted into other barriers to secure housing, including housing availability and accessibility to better understand barriers to housing and how to eliminate them.
Need help understanding population change and its impacts on your community or business? Carolina Demography offers demographic research tailored to your needs.
Contact us today for a free initial consultation.
Contact UsCategories: Economic Data, Housing

The Center for Women’s Health Research (CWHR) at the University of North Carolina School of Medicine released the 12th edition of our North Carolina Women’s Health Report Card on May 9, 2022. This document is a progress report on the…

Dr. Krista Perreira is a health economist who studies disparities in health, education, and economic well-being. In collaboration with the Urban Institute, she recently co-led a study funded by the Kate B. Reynolds Foundation to study barriers to access to…

Our material helped the NC Local News Lab Fund better understand and then prioritize their funding to better serve existing and future grant recipients in North Carolina. The North Carolina Local News Lab Fund was established in 2017 to strengthen…
Your support is critical to our mission of measuring, understanding, and predicting population change and its impact. Donate to Carolina Demography today.