In recent years, housing has become a hot-button issue both nationwide and in our state, as many people struggle to find secure, affordable housing options. David Rouse, Ben Hitchings, and Anita Brown-Graham of the UNC School of Government’s ncIMPACT Initiative wrote that the three main factors contributing to the national housing crisis are affordability, availability, and accessibility.
In this post, we examine state and NC county trends in the first of these factors: housing affordability. In another post, we look at the disparate impact on residents who rent their homes.
Housing affordability is literally a life-or-death issue, as the Eviction Lab found that high housing costs increase renters’ risk of death because households cut back on spending on essentials such as food and healthcare to continue rent payments.
North Carolina is no stranger to affordable housing availability issues, as 182,643 very-low income households cannot find affordable rental units, leading many low-income households to live in substandard housing.
One way to measure housing affordability in an area is by calculating the percent of households that are “housing cost burdened.” For this analysis, housing cost burdened is defined as households that pay over 30% of gross household income on housing and earn less than $75,000 per year. Although other analyses define housing cost burden as simply spending over 30% of income on housing costs regardless of income, we think it’s useful to consider income as well, considering that the lack of affordable housing poses a disproportionate challenge for low-income households.
All analyses used the most up-to-date data available. National and state-level analyses use 1-year American Community Survey (ACS) estimates (2014-2024), and county-level analysis used the 2023 5-year ACS.
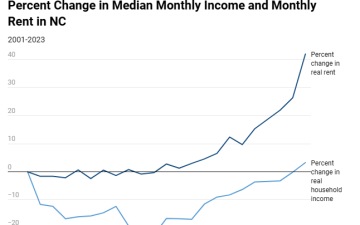
Nationally, 26.0% of households are housing cost burdened. Housing cost burden in North Carolina (26.1%) is on par with the national rate, but housing affordability varies widely across the state.
From 2014 to 2024, the nationwide housing cost burden rate decreased with some fluctuation from 30.9% to 26.0% of occupied housing units, for an overall 4.9 percentage point decrease.
North Carolina followed a similar trend to the rest of the country, with housing cost burden falling from 30.3% to 26.1% in the same period.
From 2014-2016 the data only contain percents, not totals, of housing cost burden. However, starting in 2017, we can compare changes in percent housing cost burden to changes in the total number of cost burdened households. Although the housing cost burden rate decreased slightly from 2017 to 2024, the total number of housing cost burdened households increased by 140,740, from 1,033,243 households in 2017 to 1,173,983 in 2024. This increase is approximately equivalent to Harnett County’s population in 2024.
Housing cost burden rates in NC counties range from 14.8% in Alexander County to 33.9% in Cumberland County. Alexander County is the only county with a housing cost burden rate below 15%. Seven counties — Cumberland, Edgecombe, Halifax, Hertford, Onslow, Richmond, and Watauga — have rates exceeding 30%. Higher rates of housing cost burden occur mainly in the eastern part of the state, with notable exceptions of Watauga County, which has the second highest housing cost burden rate, Buncombe County, and Clay County in Western NC.
At the county level, housing cost burden rates generally decreased from 2013 to 2023. In Chowan County and Currituck County, housing cost burden decreased by 14.6 percentage points, the greatest decrease. The greatest increase in housing cost burden was in Hyde County, which saw a 2.4 percentage point increase in housing cost burden, from 27.0% to 29.4%. The next highest change in housing cost burden was in Anson County, with a -0.3 percentage point change.
It’s important to note that housing costs on Ocracoke Island, which was directly impacted by Hurricane Dorian in 2019, have a large influence on Hyde County figures. In fact, from 2021 to 2023, housing cost burden in the census tract containing Ocracoke Island increased by 11.5%, while the rest of the county had a -12.6% decrease in housing cost burden.
Although housing cost burden rates are lower on average in North Carolina than the rest of the country, there are significant disparities between counties in North Carolina. Also, housing cost burden rates have generally declined since 2013, but there is still a significant portion of housing cost burdened households, and the number of these households is growing. Given the health implications of housing unaffordability, efforts to address North Carolina’s housing cost burden are also likely to improve public health and the well-being of North Carolinians.
Need help understanding population change and its impacts on your community or business? Carolina Demography offers demographic research tailored to your needs.
Contact us today for a free initial consultation.
Contact UsCategories: Economic Data, Housing

The Center for Women’s Health Research (CWHR) at the University of North Carolina School of Medicine released the 12th edition of our North Carolina Women’s Health Report Card on May 9, 2022. This document is a progress report on the…

Dr. Krista Perreira is a health economist who studies disparities in health, education, and economic well-being. In collaboration with the Urban Institute, she recently co-led a study funded by the Kate B. Reynolds Foundation to study barriers to access to…

Our material helped the NC Local News Lab Fund better understand and then prioritize their funding to better serve existing and future grant recipients in North Carolina. The North Carolina Local News Lab Fund was established in 2017 to strengthen…
Your support is critical to our mission of measuring, understanding, and predicting population change and its impact. Donate to Carolina Demography today.