NC Census Tracker Updates
Presentations and Downloads
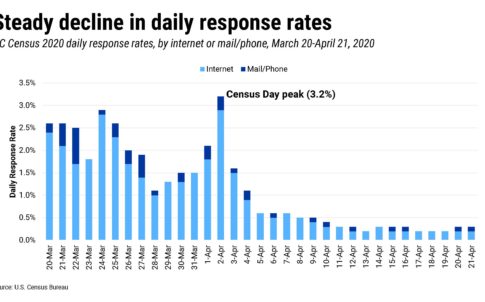
Note: The below analysis was done on 4/22/2020 with the self-response rate data released at 3:00 p.m. on Tuesday, April 21, to try to better understand trends in North Carolina’s response to the 2020 Census.
Analysis: Foreign-Born Residents
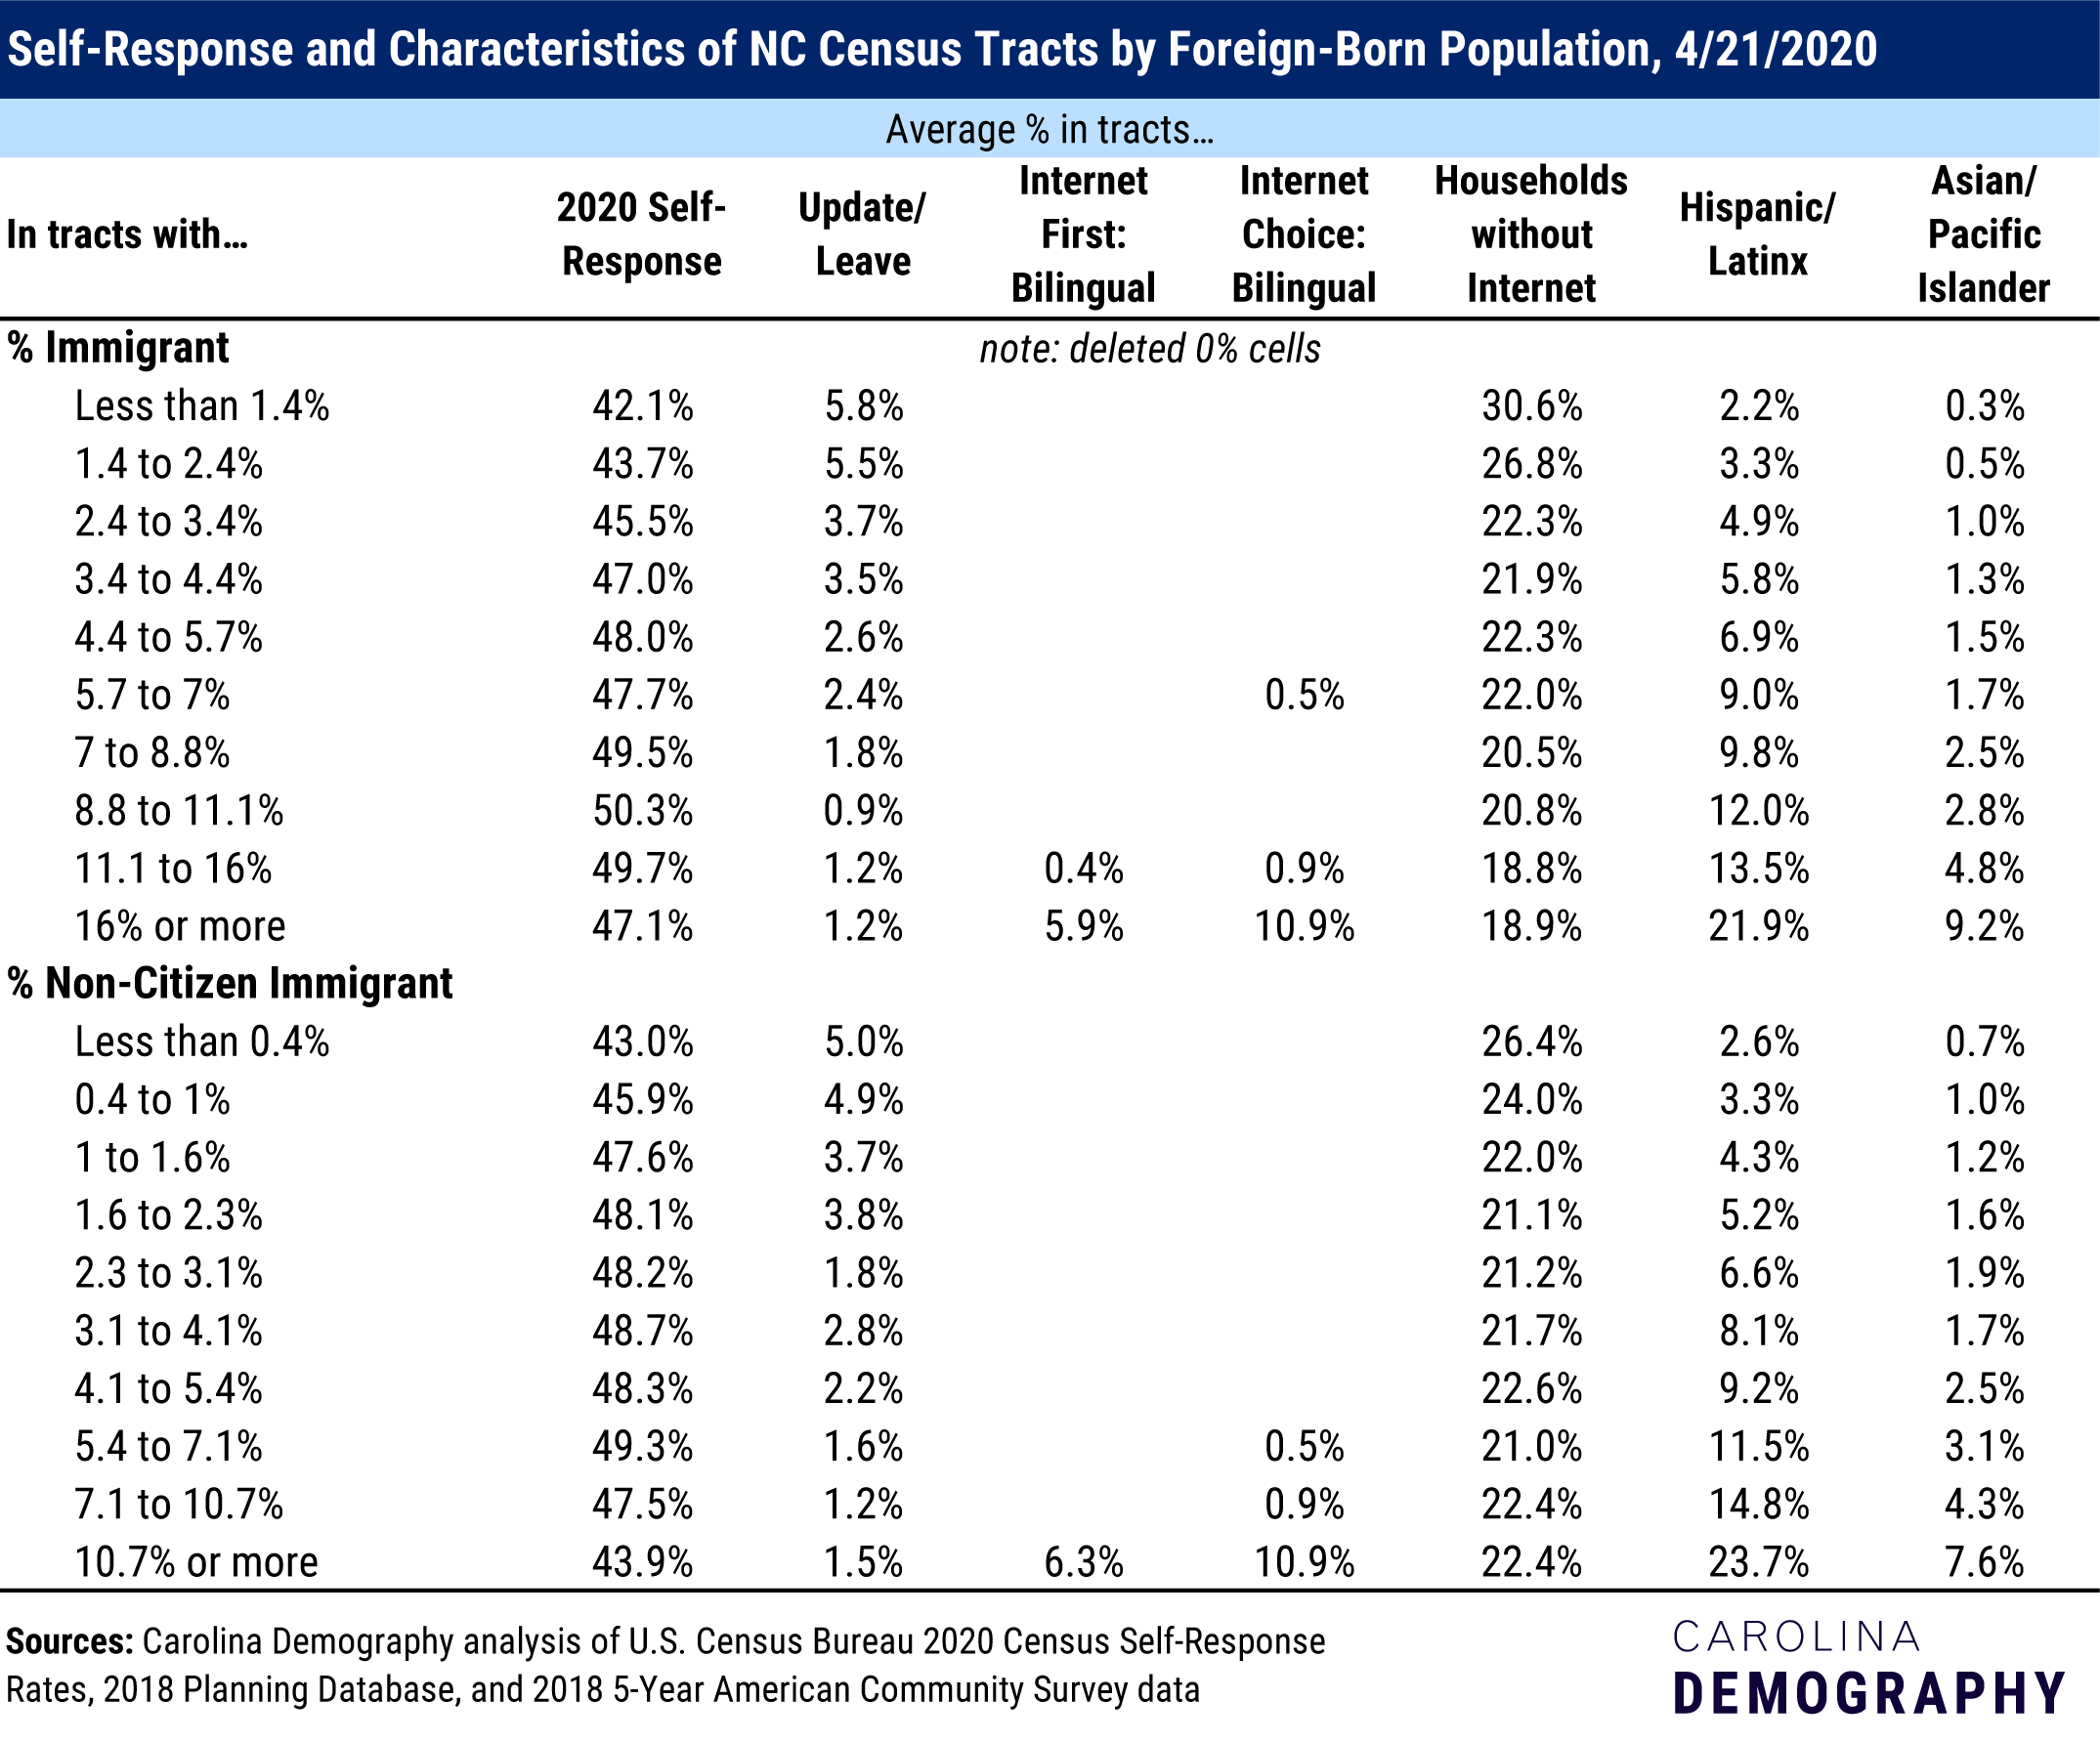
We are seeing, on average, higher self-response rates in census tracts with higher foreign-born residents.
At the same time, tracts where the largest racial/ethnic group is Hispanic/Latinx have lower average self-response rates. Average self-response rates by dominant race/ethnic group is:
I tried to unpack these differences by splitting tracts into 10 categories based on the size of the foreign-born population and also looked at the non-citizen foreign-born population (see below table). There are about 217 tracts in each segment. A few interesting things:
% Foreign-Born
% Non-Citizen Foreign-Born
Examining Predominantly Hispanic Tracts
I also looked at the average self-response in the 29 predominantly Hispanic census tracts by county. Thirteen counties have at least one predominantly Hispanic tract.. The list below includes county name (# of predominantly Hispanic tracts) and the average 2020 self-response (as of 4/21/2020) in these tracts:
Contact strategies for predominantly Hispanic tracts
All households in predominantly Hispanic tracts in Alamance, Cabarrus, Lee, Sampson, Union, and Wayne were contacted by Internet Choice: Bilingual (questionnaire in first mailing), as were most households in Chatham (99.4%). While the predominantly Hispanic tract in Alamance has a higher self-response rate than the state average (48.2%), this was not a pattern seen in the other counties.
9.6% of households in Duplin were supposed to receive their questionnaire through Update/Leave. Duplin has the lowest self-response rate among predominantly Hispanic tracts (27.1%) of any county. The share of households in predominantly Hispanic tracts receiving their questionnaire by Update/Leave was less than one percent in Durham (0.8%), Chatham (0.6%), Forsyth (0.3%), and Mecklenburg (0.1%).
In Guilford (100%), Durham (52.2%), Mecklenburg (44.6%), and Forsyth (25%), large portions of households predominantly Hispanic tracts were contacted by Internet First: Bilingual, meaning they may not have received a paper questionnaire yet. These communities may see increased response rates with the mailing of the paper questionnaire in April.
With the exception of Forsyth County, the relationship between response rates in predominantly Hispanic tracts and the share of households contacted by Internet First: Bilingual mailings may explain a large portion of the lower performance among these tracts in urban counties. In Forsyth County, 42.6% of households in its predominantly Hispanic tracts were contacted by Internet Choice: English for the census. This may influence some of the lower response in Forsyth.
Last, in Wake County, 100% of households in its predominantly Hispanic tract were contacted with Internet First: English. This was the contact strategy for 46.7% of households in predominantly Hispanic tracts in Mecklenburg. The paper questionnaire in April may also help increase response rates in these communities, assuming that English literacy is not a barrier for most households.
Need help understanding population change and its impacts on your community or business? Carolina Demography offers demographic research tailored to your needs.
Contact us today for a free initial consultation.
Contact UsCategories: Carolina Demographics, Census 2020

The Center for Women’s Health Research (CWHR) at the University of North Carolina School of Medicine released the 12th edition of our North Carolina Women’s Health Report Card on May 9, 2022. This document is a progress report on the…

Dr. Krista Perreira is a health economist who studies disparities in health, education, and economic well-being. In collaboration with the Urban Institute, she recently co-led a study funded by the Kate B. Reynolds Foundation to study barriers to access to…

Our material helped the NC Local News Lab Fund better understand and then prioritize their funding to better serve existing and future grant recipients in North Carolina. The North Carolina Local News Lab Fund was established in 2017 to strengthen…
Your support is critical to our mission of measuring, understanding, and predicting population change and its impact. Donate to Carolina Demography today.