A few months ago, Carolina Demography’s director, Rebecca Tippett, asked me to develop 100 detailed one-pager reports with over 120 data fields – one for each county in North Carolina.
As a graphic designer, coding in a brand-new language seemed overwhelming, but the idea of entering 120 data fields on each page would have been time-consuming, opened up the possibility of transcription errors, and required hours of copyediting.
So I spent the next few weeks learning the statistical computing language “R” along with formatting syntax to generate printable reports. In this post, I will describe my process of learning R, the resources and tools I used, and share some discoveries I made along the way.
I work for Carolina Demography, an applied demography group within the Carolina Population Center at the University of North Carolina at Chapel Hill. We help people across North Carolina make data-informed decisions for the future.
Carolina Demography has worked with state education data for several years, developing reports and analysis to inform policy decisions. Our latest work, in partnership with My Future NC and the John M. Belk Endowment, is a statewide attainment dashboard to serve as a shared, nonpartisan source of information about the state of education in North Carolina. The dashboard tracks proven indicators along the education continuum, capturing key transition points for students from NC Pre-K enrollment through degree or credential completion and into the labor market.
We also created detailed information at the county level to inform ongoing efforts across the state. This blog post details how they were created using the R programming language.
We wanted to develop a unique PDF fact-sheet for each county in NC and update those fact sheets on a yearly basis. Doing this manually would be time-consuming and introduce the possibility of errors.
I first started by looking at best practices across the field, including the Urban Institute’s use of Rmarkdown to construct factsheets .
Rmarkdown allows the production of reports that can include R code “chunks” or other programming languages such as HTML. I also learned that there were experienced R users both at the Carolina Population Center, where Carolina Demography is based, and the UNC Chapel Hill Undergraduate Library. I would come to rely on these resources for assistance and to refine my code for making iterative factsheets.
Below, I detail the steps needed to install R and Rstudio on your computer.
To begin, install Rstudio on your computer and be sure you have the latest version of R. Out of the box, Rstudio doesn’t come preloaded with all the “packages” that are available, so you will need to install these as well.
Tidyverse bunches several useful and important packages together such as ggplot2 and readr.
The internet is full of tutorials to get you started. I used the free tutorial from Codecademy which got me familiar with the fundamentals of R, minor data frame manipulation, and data visualization. After using the structured courses from Codecademy the rest of my experience came from running into problems and tackling them one by one. Note, that my application of R does not require me to use the data science and analysis side of R. Instead, I was using the parts of R that made it possible to combine data visualizations, HTML, CSS, and import data from spreadsheets. This is all made possible through Rmarkdown.
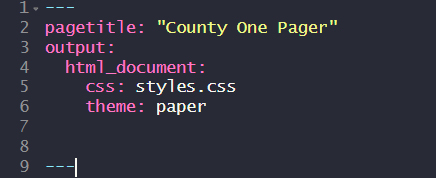
Speaking of HTML and CSS, you might be wondering why I used web languages to lay out a PDF. There is a function built into Rmarkdown that lets you “knit” your code and output a PDF from Rstudio, but it requires the use of a markup language called LaTeX. (If you are familiar with LaTeX, you can take this route.) I prefer to do all my markup using HTML and CSS, which gives me much more flexibility when designing. To link my Rmarkdown document to a CSS file I simply point the Rmarkdown to the CSS in the “Preamble” of the document:
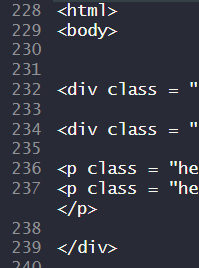
In order to get the HTML to work in Rstudio you cannot include tabs in front of the <div> tags. This makes it slightly more difficult to track your closing </div> tags but it’s worth the frustration.
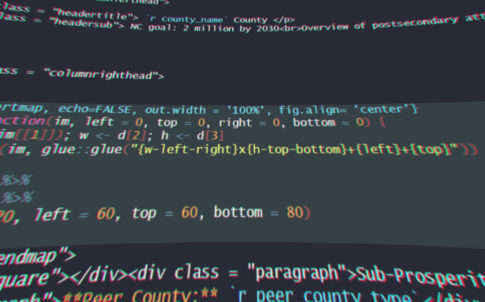
The beauty of using HTML/CSS as your markup language in Rmarkdown is that you can create almost anything. To achieve a polished layout comparable to the quality I get from Adobe InDesign, I made exactly what I wanted in InDesign, and replicated it with HTML/CSS. This was extremely important because I could get absolute measurements and map out the dividers and columns on paper.
Once I knit my code together it produces a .html file that I can convert into a PDF using Adobe Acrobat. To get it to convert correctly, all my CSS dimensions (height, width, margins, padding) are written using centimeters, not percentages!
Rmarkdown inline code is a game changer. With inline code I can include R code chunks as part of a sentence. I can either write the function directly inline or I can make the function outside the HTML and then call for it inline.
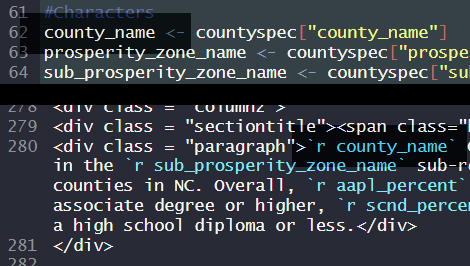
Finally, the strategy to achieve iteration is quite simple. The team worked together to devise a way for the spreadsheet to supply the variable data and text. The table rows are filtered by county name and then each column is given a variable assignment in the Rmarkdown which includes number formatting for thousand separators and percentages.
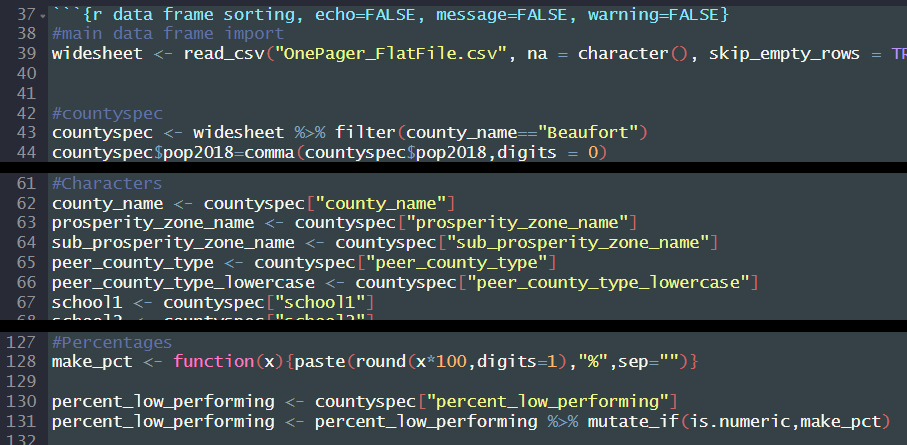
This is the function (lines 127-131) I used to convert decimals from the spreadsheet into percentages with a “%” symbol and no decimal digits. This code represents how I wrote variables to capture all the columns of data in the .csv spreadsheet. Not only did I need to specify where to look for the specific variable, I needed to define how to display the data which that variable pulled. Line 44 uses the comma function to insert commas per thousand and include 0 decimal digits.
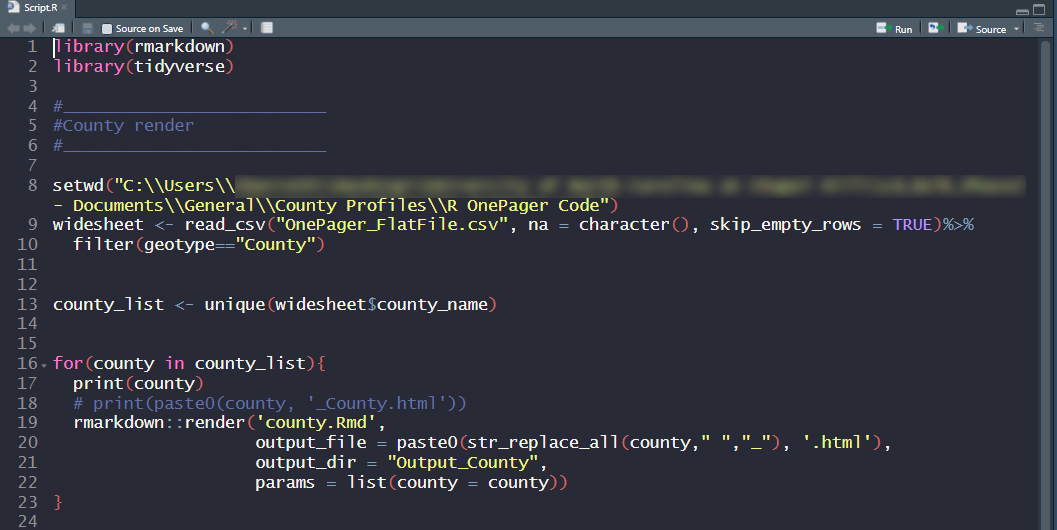
The real magic happens when you link the Rmarkdown file to a script. The script is quite simple but very powerful. It is how I can produce a one-pager for every county, sub-Prosperity Zone, and the state with a single click. It identifies the data source, (the big .csv spreadsheet) calls up a for loop to cycle through all the rows of data and render the rmarkdown. It will continue to render until all the rows have been looped through.
This is what my script file looks like:
The key to changing the county_name variable in the Rmarkdown using the script file is through Params. Params can then be called across files in the preamble:
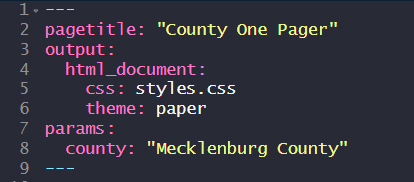
The params work only when you “prime” the variable with a value in the preamble. In this case it is primed to reflect any value in the county column of the spreadsheet. Knitting the .Rmd will produce an html file like it normally does, and running the script will produce all unique instances of the .Rmd as per the values in the spreadsheet.
To view the finished county and state one-pagers visit: https://dashboard.myfuturenc.org/county-data-and-resources/
Some useful resources:
https://www.w3schools.com/css/
https://www.w3schools.com/html/
I was able to solve most of my problems through google, but I also had expert help from colleagues, including Matt Jansen, Data Analysis Librarian at UNC Chapel Hill’s University Library, Brian Frizzelle, CPCs Director of Research Programming & Spatial Analysis, and Brandt Levitt, Genomic Data Scientist and GWAS Data Coordinator. For help and further reference, feel free to email demography@unc.edu.
Need help understanding population change and its impacts on your community or business? Carolina Demography offers demographic research tailored to your needs.
Contact us today for a free initial consultation.
Contact UsCategories: Carolina Demographics, Lessons Learned

The Center for Women’s Health Research (CWHR) at the University of North Carolina School of Medicine released the 12th edition of our North Carolina Women’s Health Report Card on May 9, 2022. This document is a progress report on the…

Dr. Krista Perreira is a health economist who studies disparities in health, education, and economic well-being. In collaboration with the Urban Institute, she recently co-led a study funded by the Kate B. Reynolds Foundation to study barriers to access to…

Our material helped the NC Local News Lab Fund better understand and then prioritize their funding to better serve existing and future grant recipients in North Carolina. The North Carolina Local News Lab Fund was established in 2017 to strengthen…
Your support is critical to our mission of measuring, understanding, and predicting population change and its impact. Donate to Carolina Demography today.