
This is the first in a three-part series on North Carolina’s voters. Today, we take a look at North Carolina’s 7 million registered voters. In the coming days, we will take a look at North Carolina’s registered Republicans and Democrats, respectively.
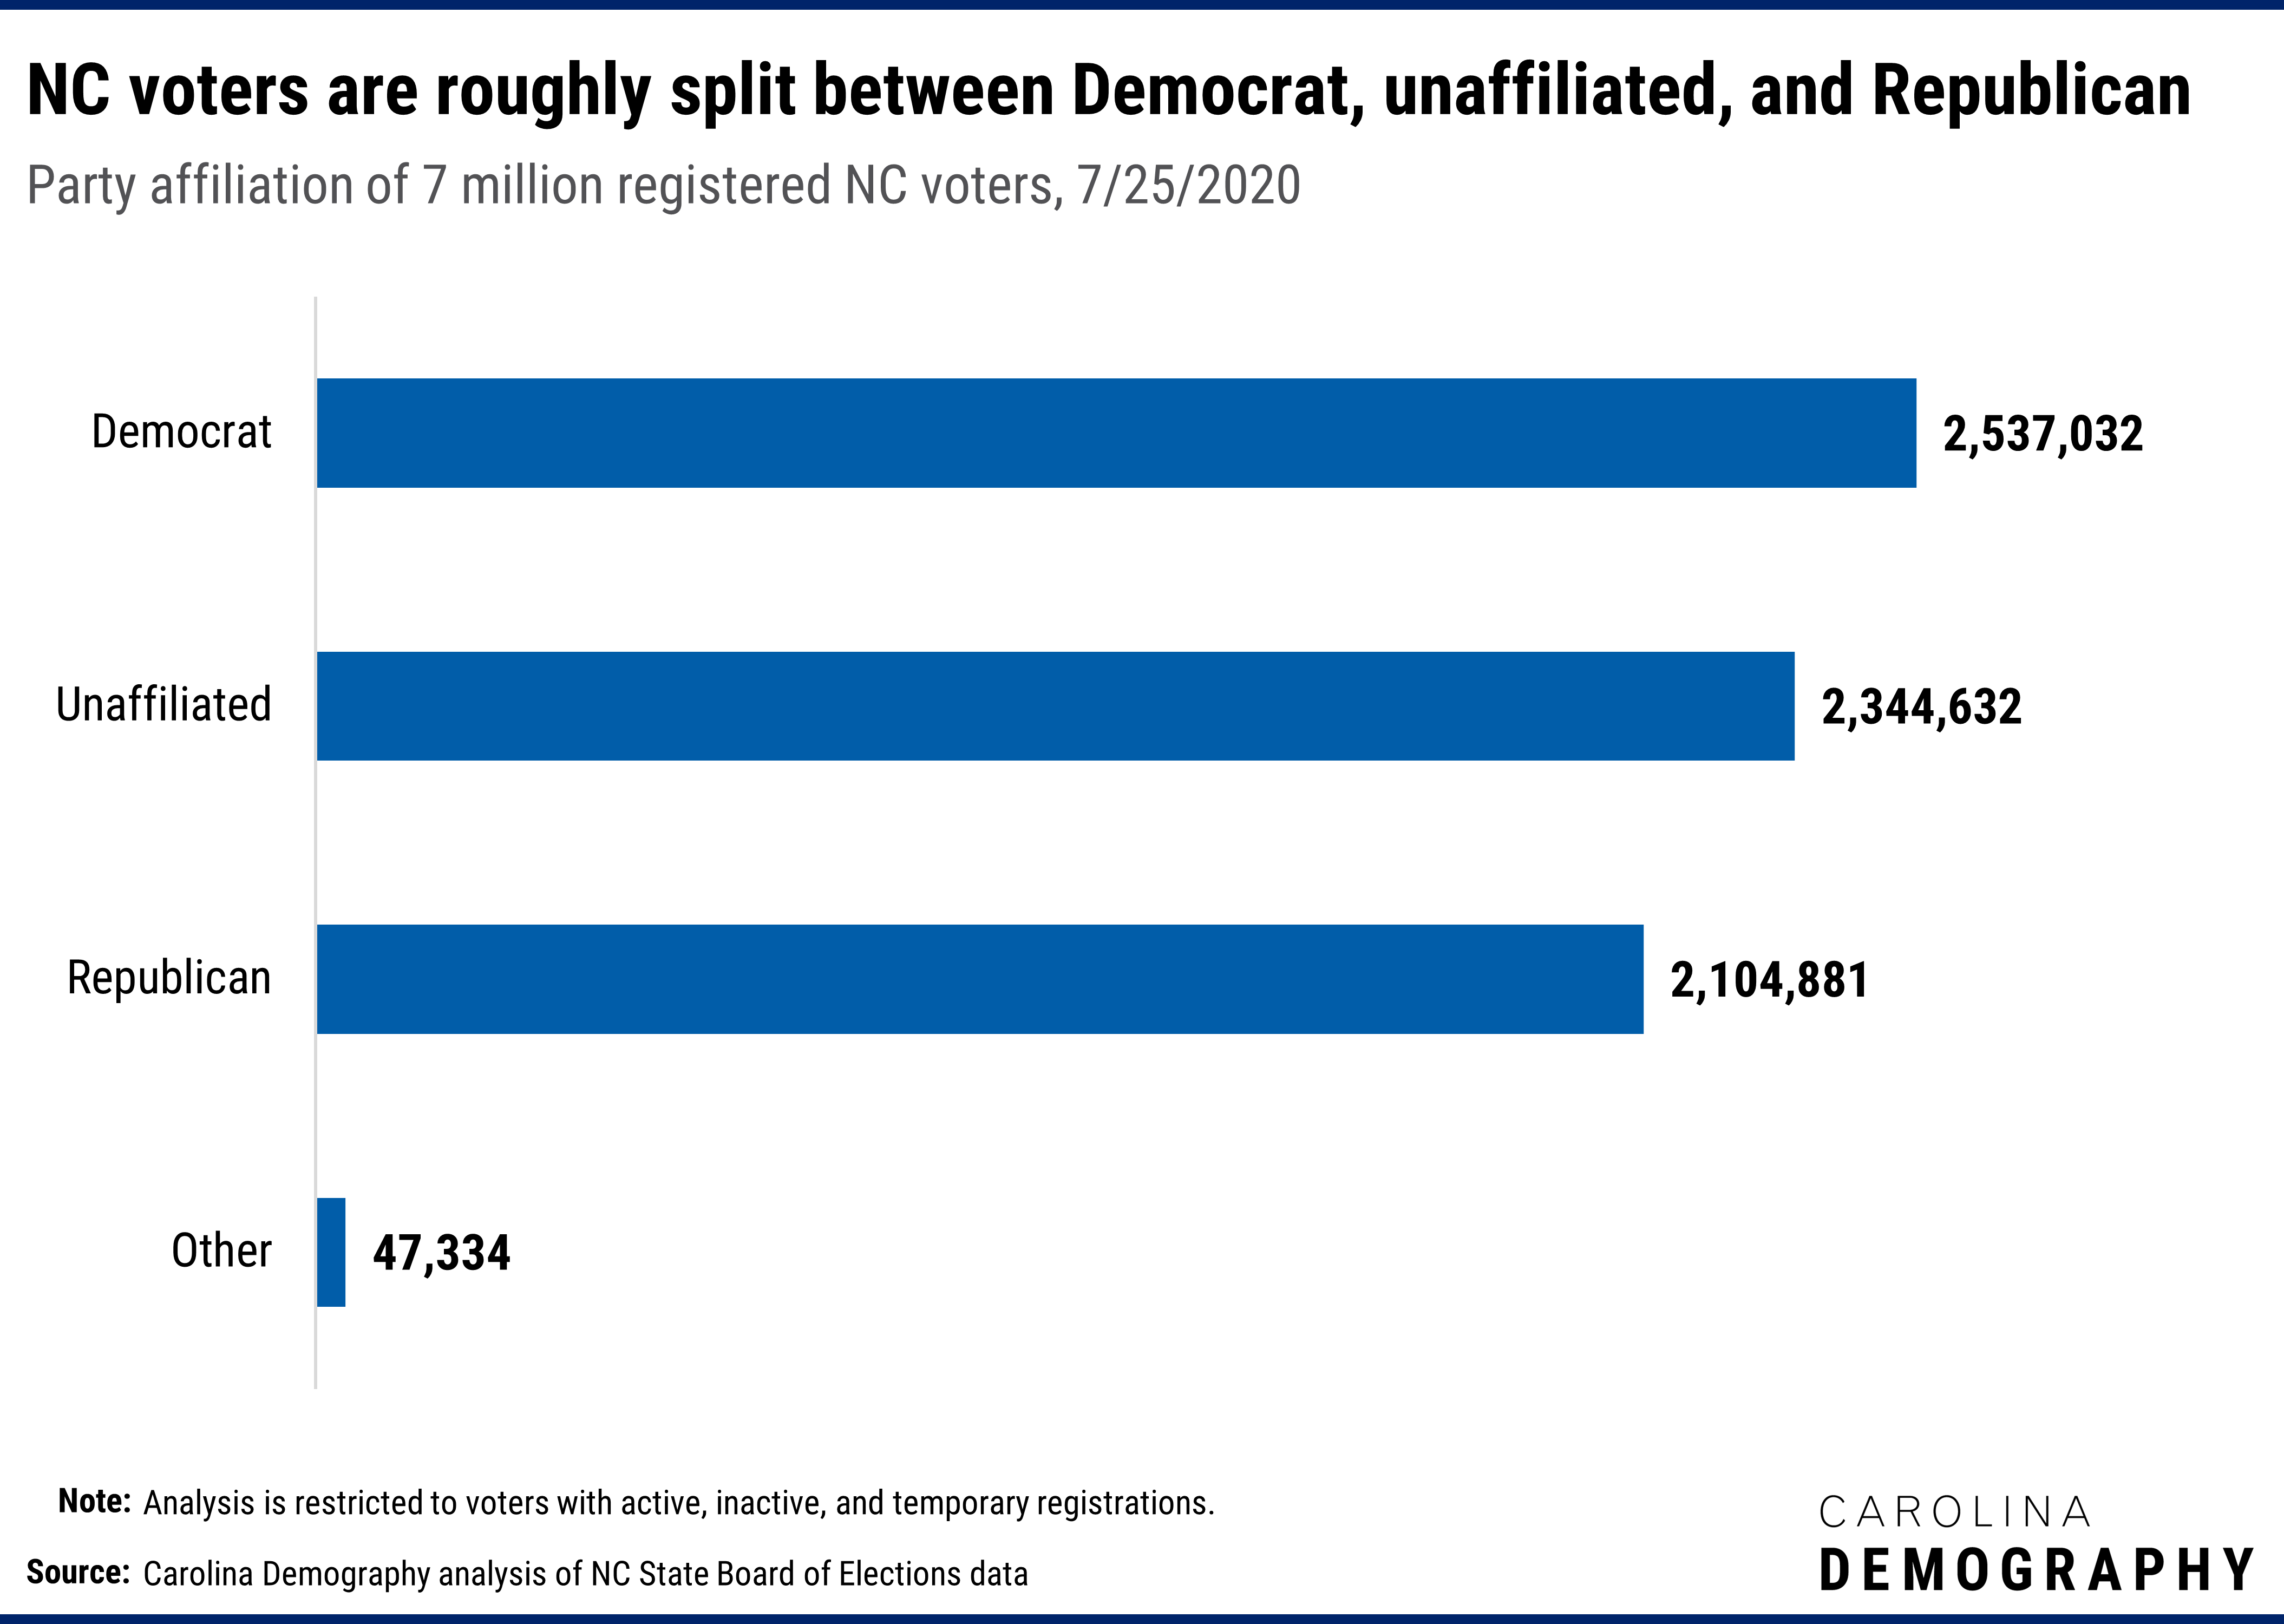
As of July 25th, 2020, North Carolina had about 7.8 million voting-eligible adults and 7 million registered voters. Their partisan affiliation was roughly split between three groups: Democrat, unaffiliated, and Republican, with a slight lead to Democrats. Specifically:
Other party registrations included Libertarian (41,170 or 0.6%), Constitution Party (3,646 or 0.05%), and Green Party (2,518 or 0.04%).
Who are these voters? And how do demographic characteristics vary among the largest affiliation groups (Democratic, Republican, and unaffiliated)?
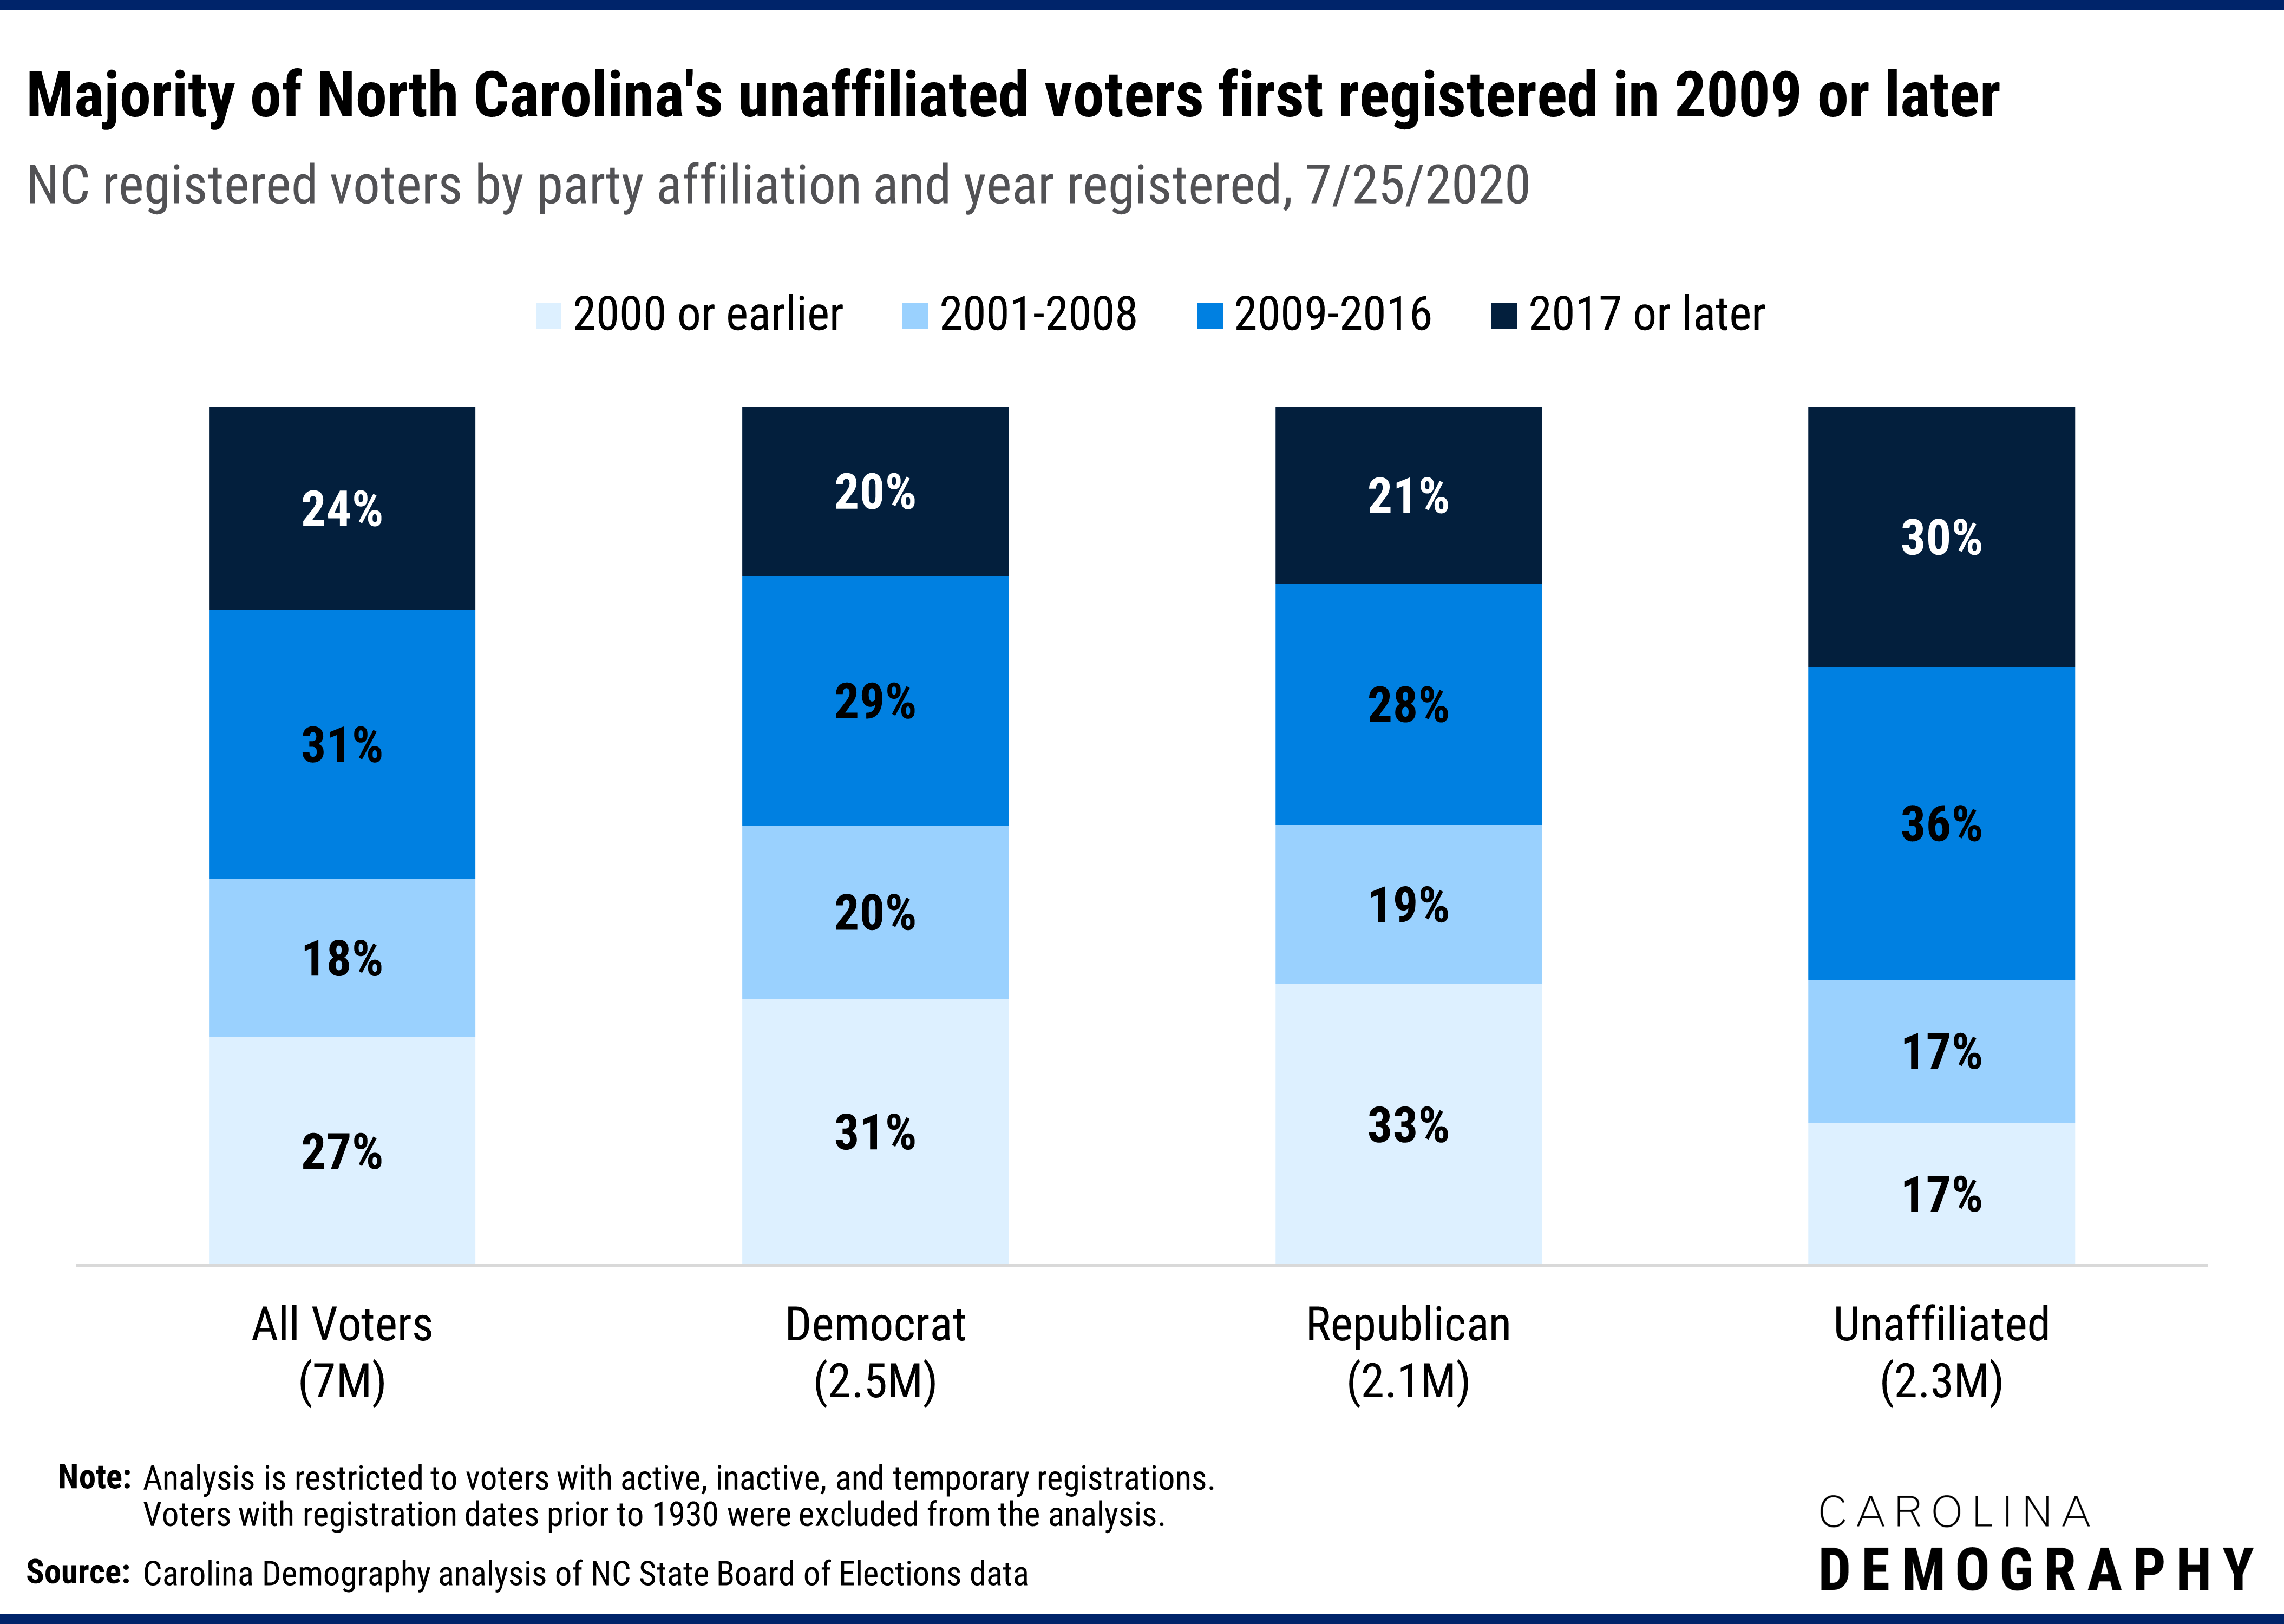
Statewide, just over one fourth (27%) of voters first registered to vote in 2000 or early. This was roughly one in three of North Carolina’s Democrat and Republican voters and less than one in five unaffiliated voters first registered during this time.
Two-thirds of unaffiliated voters first registered between either 2009-2016 (36%) or in 2017 or after (30%); less than half of Democrat and Republican voters registered in 2009 or later. This reflects two factors: first, age group differences in partisan affiliation and second, the rise of unaffiliated voters in recent years.
Young voters are more likely to register as unaffiliated than any other age group: 43% of 18-34 year-olds are registered unaffiliated versus 35% of 35-44 year-olds, 26% of 55-74 year-olds, and 21% of voters 75 and older.
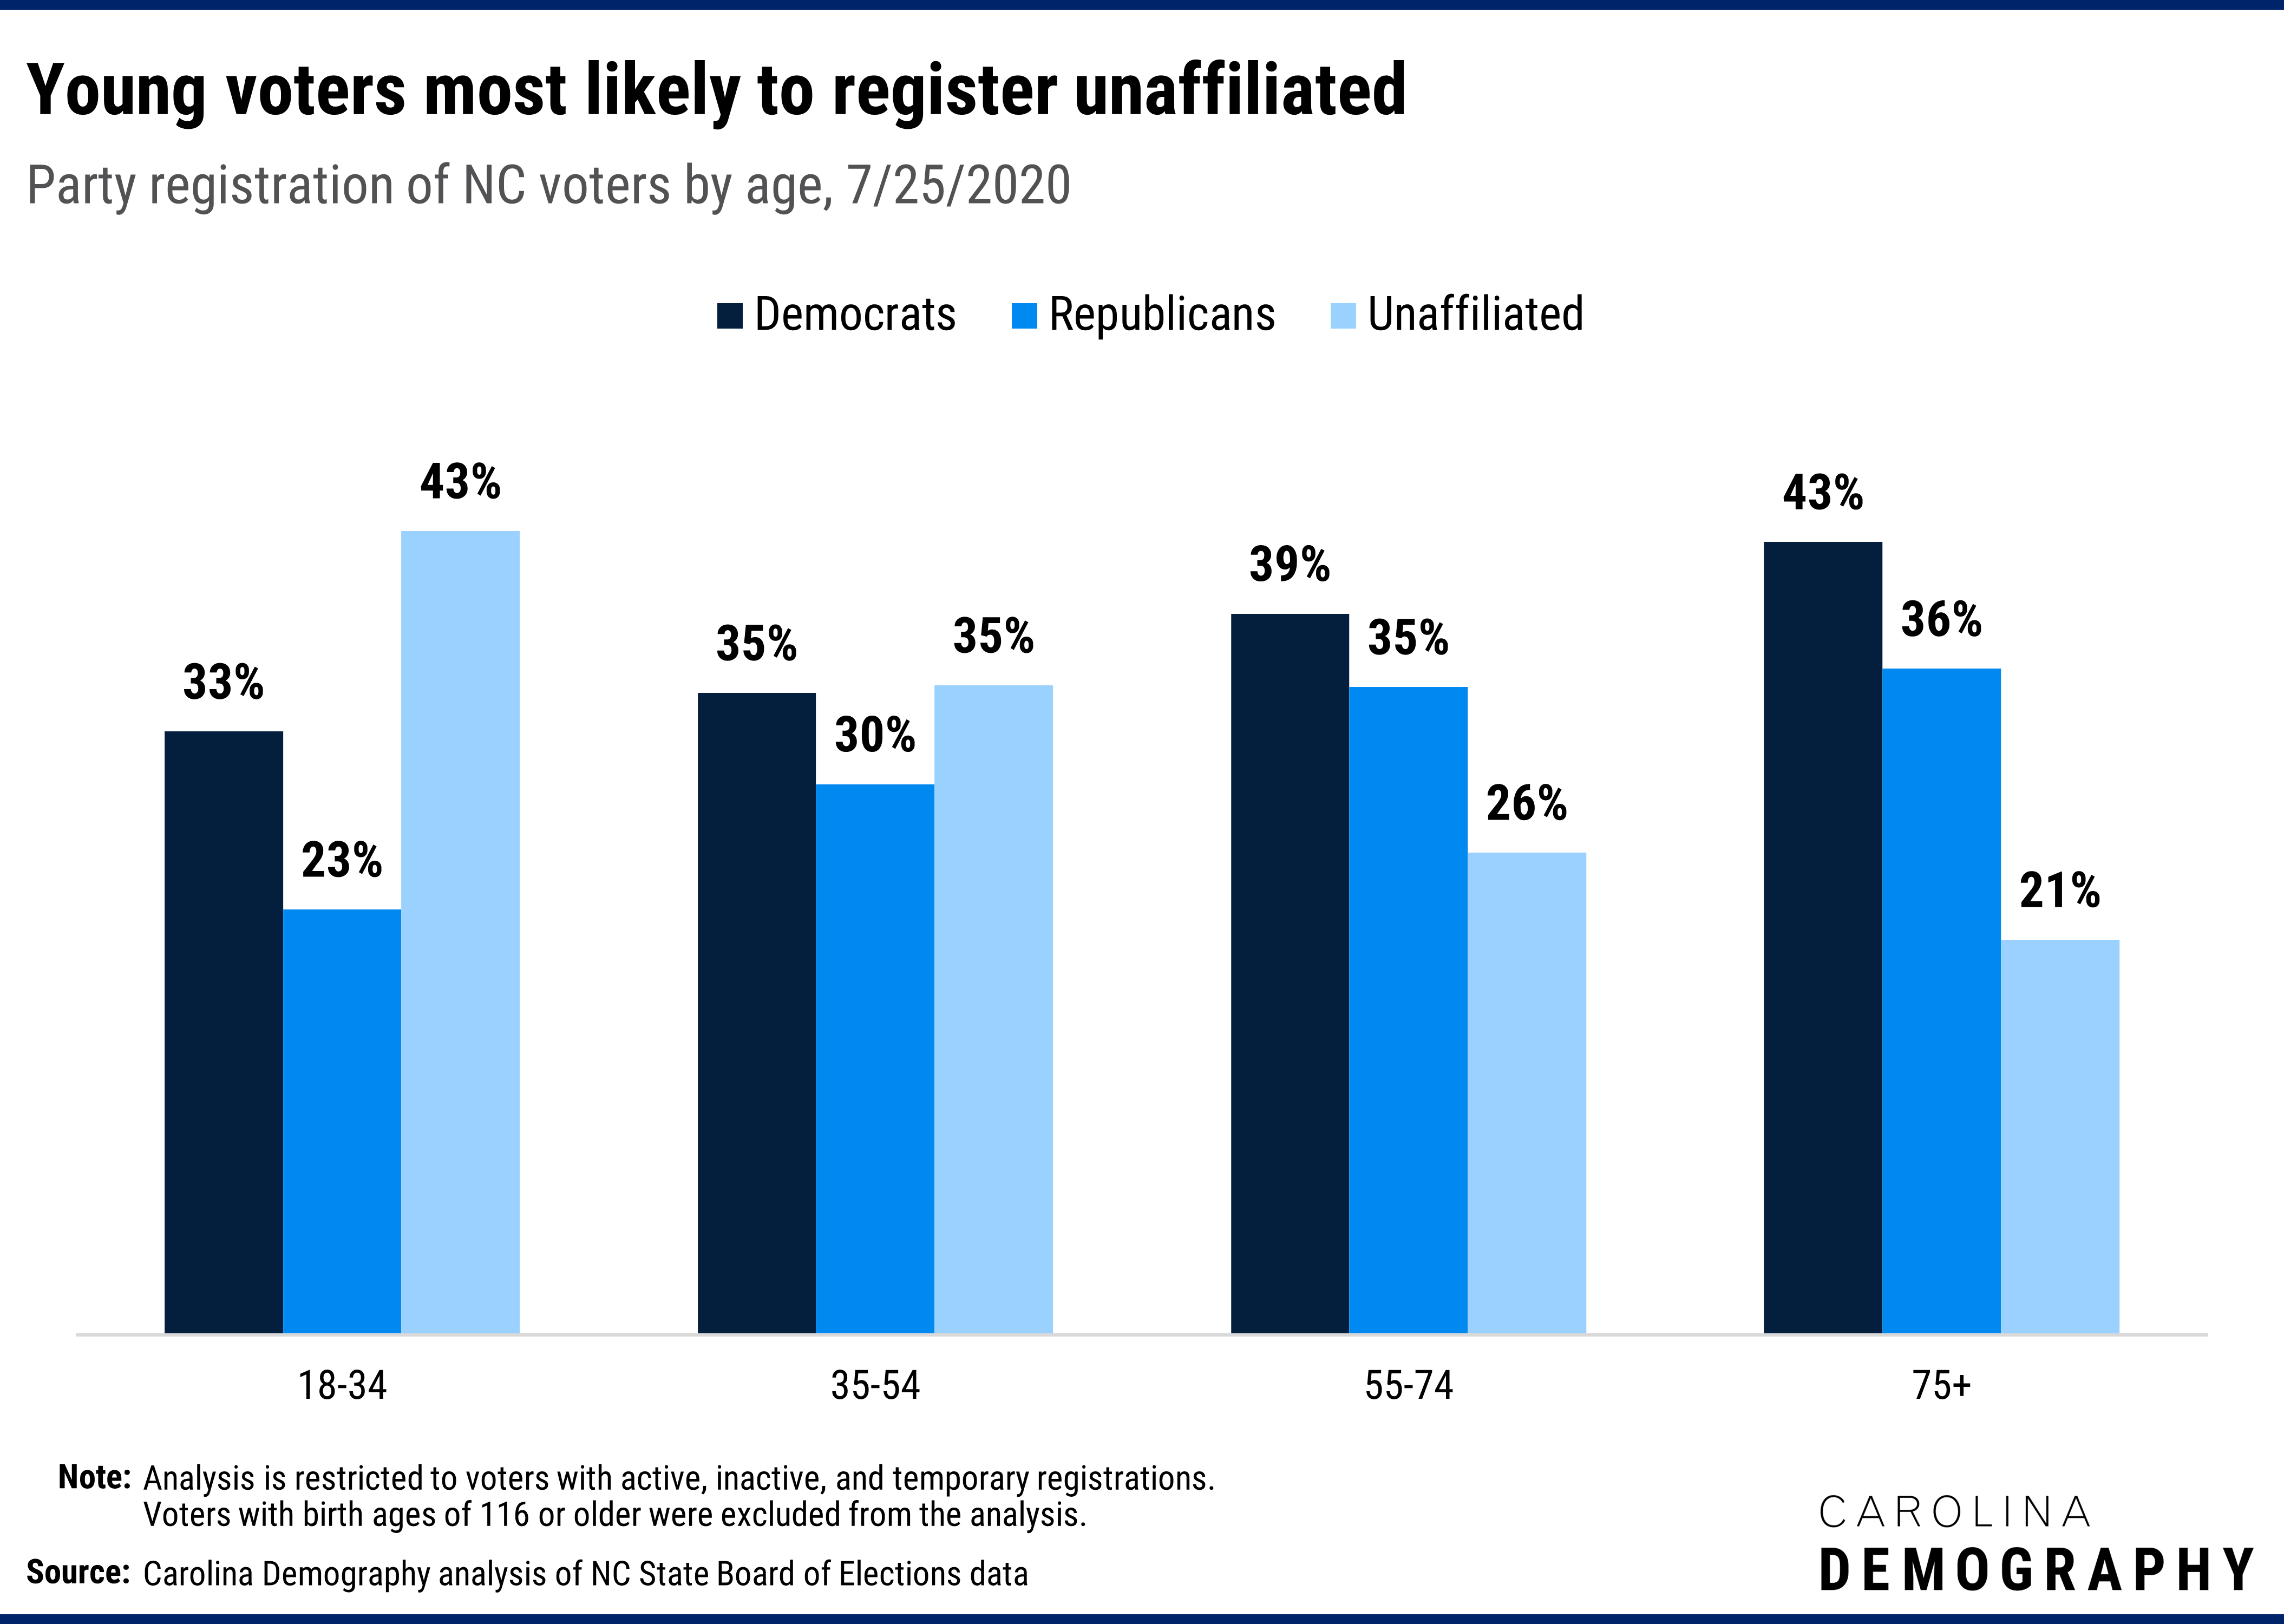
Conversely, 18-34 year-olds are least likely to register as Republican (23%) and adults ages 55-74 (35%) and 75 and older (36%) are the most likely to register as Republican. Older voters—ages 75 and older—are the most likely to register as Democrats (43%), followed by voters 55-74 (39%).
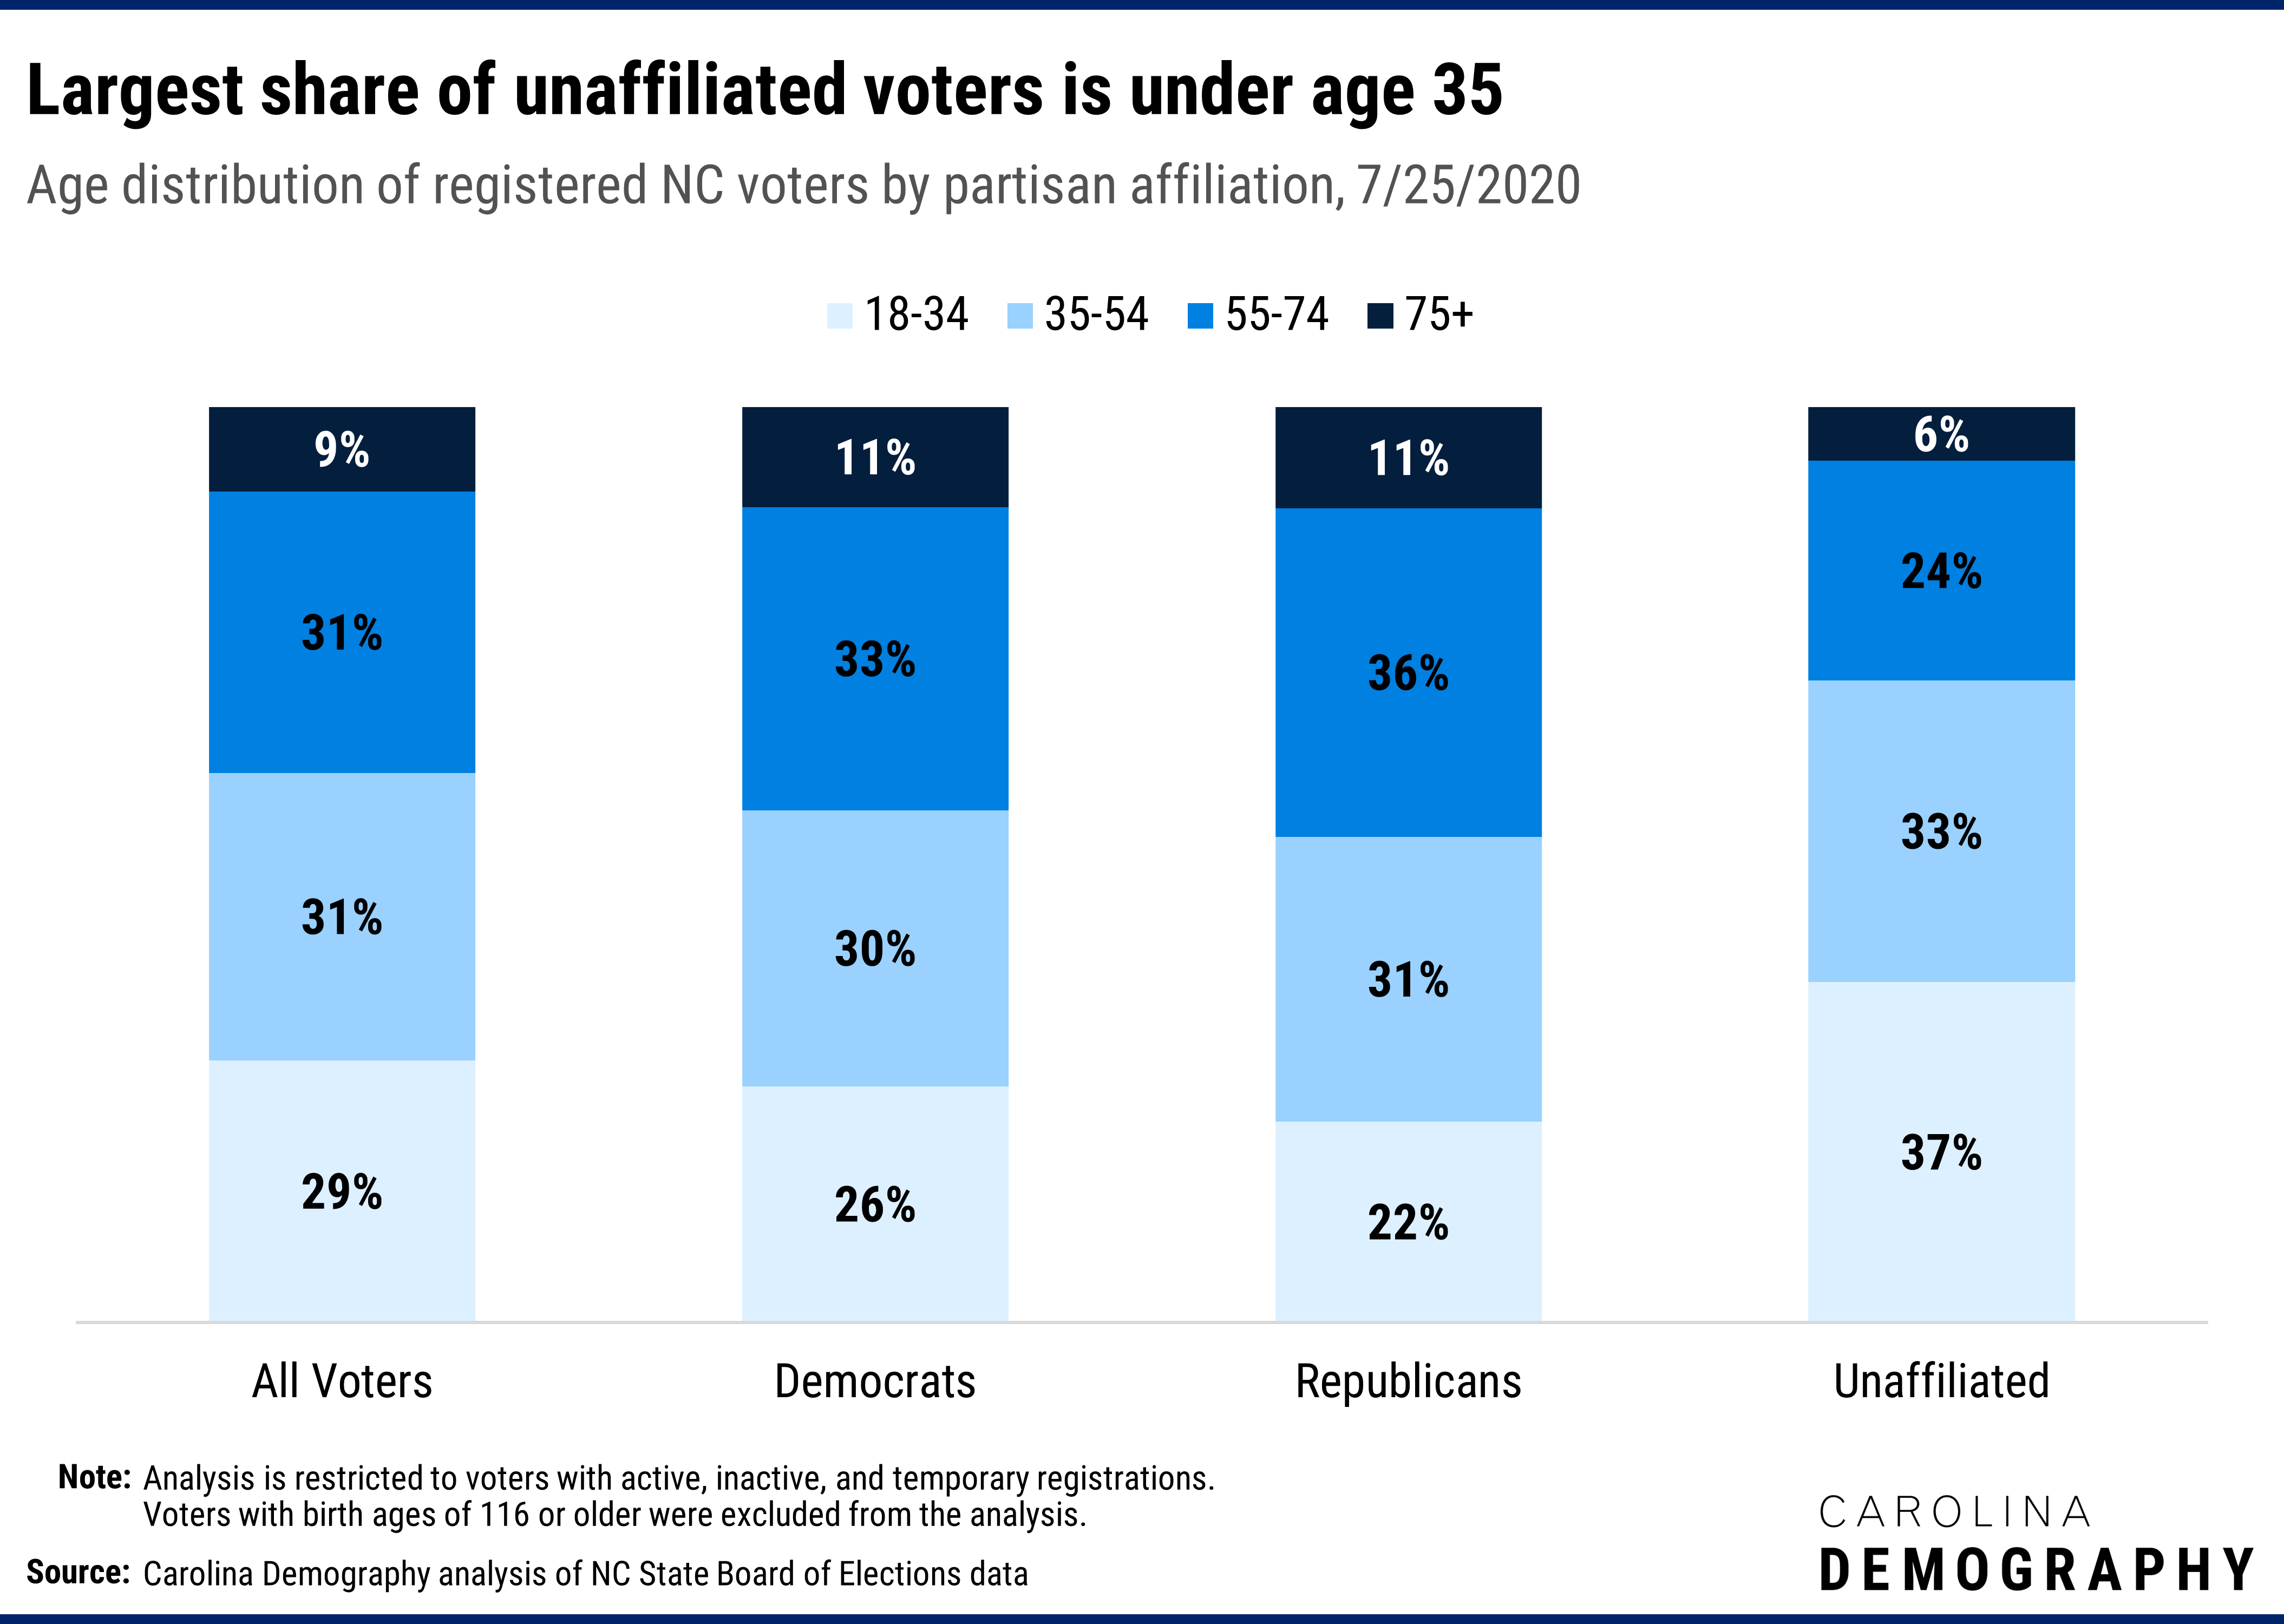
Reflecting these age patterns in partisan affiliation, the youngest voters make up the smallest share of Republican voters (22%) and the largest share of unaffiliated voters (37%). Meanwhile, both Republican and Democrat registered voters have a higher share of voters ages 55-74 and a slightly higher share of 75 and older than the electorate overall.
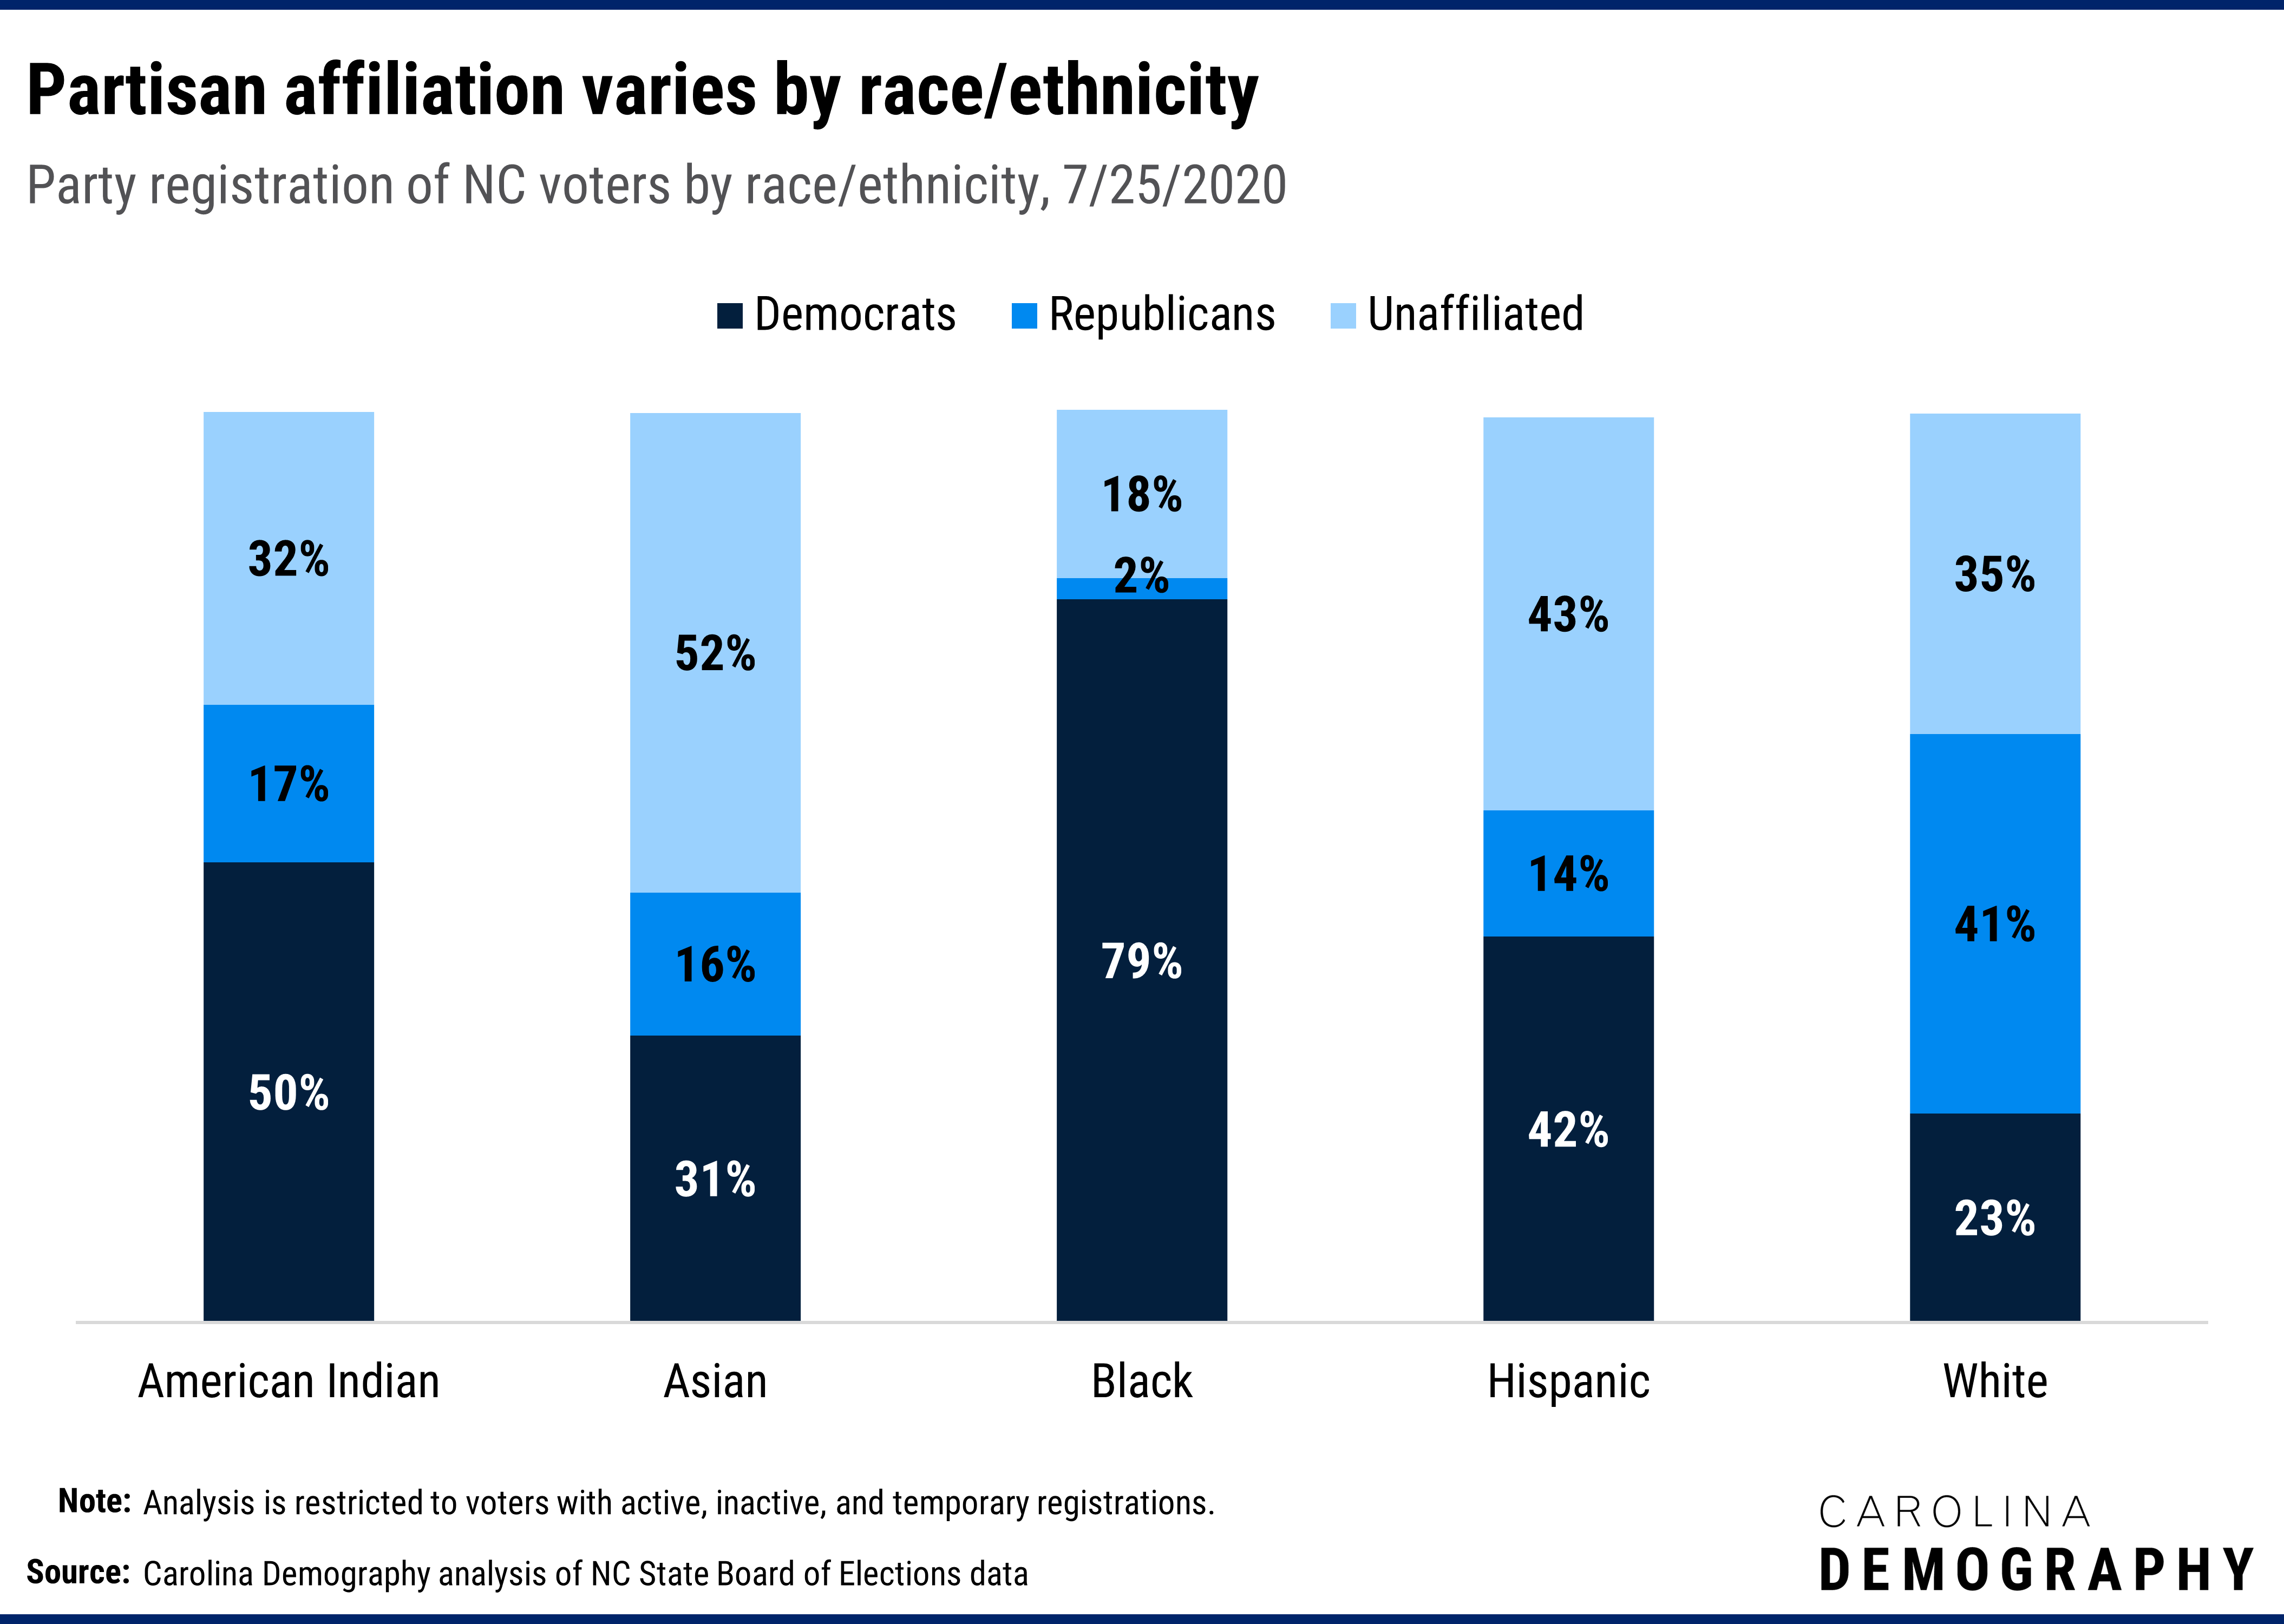
There are significant differences in party registration by race and ethnicity. Black (79%) and American Indian (50%) voters are most likely to be registered Democrat while white (23%) voters are least likely to be registered Democrat. In contrast, white voters (41%) are most likely to be registered Republican and black (2%) voters are least likely to be registered Republican. Asian (52%) and Hispanic (43%) voters are most likely to be registered unaffiliated, followed by white (35%) and American Indian voters (32%). Black voters (18%) are the least likely to be registered unaffiliated.
As a result of these differing registration patterns, North Carolina’s registered Republicans are overwhelmingly white. Ninety-one percent of Republican voters are white compared to 65% of the electorate overall.
Democratic voters are the only party where white voters are a minority of registered voters: 43% of registered voters identify as white. Black voters comprise the largest share of registered Democrats (45%).
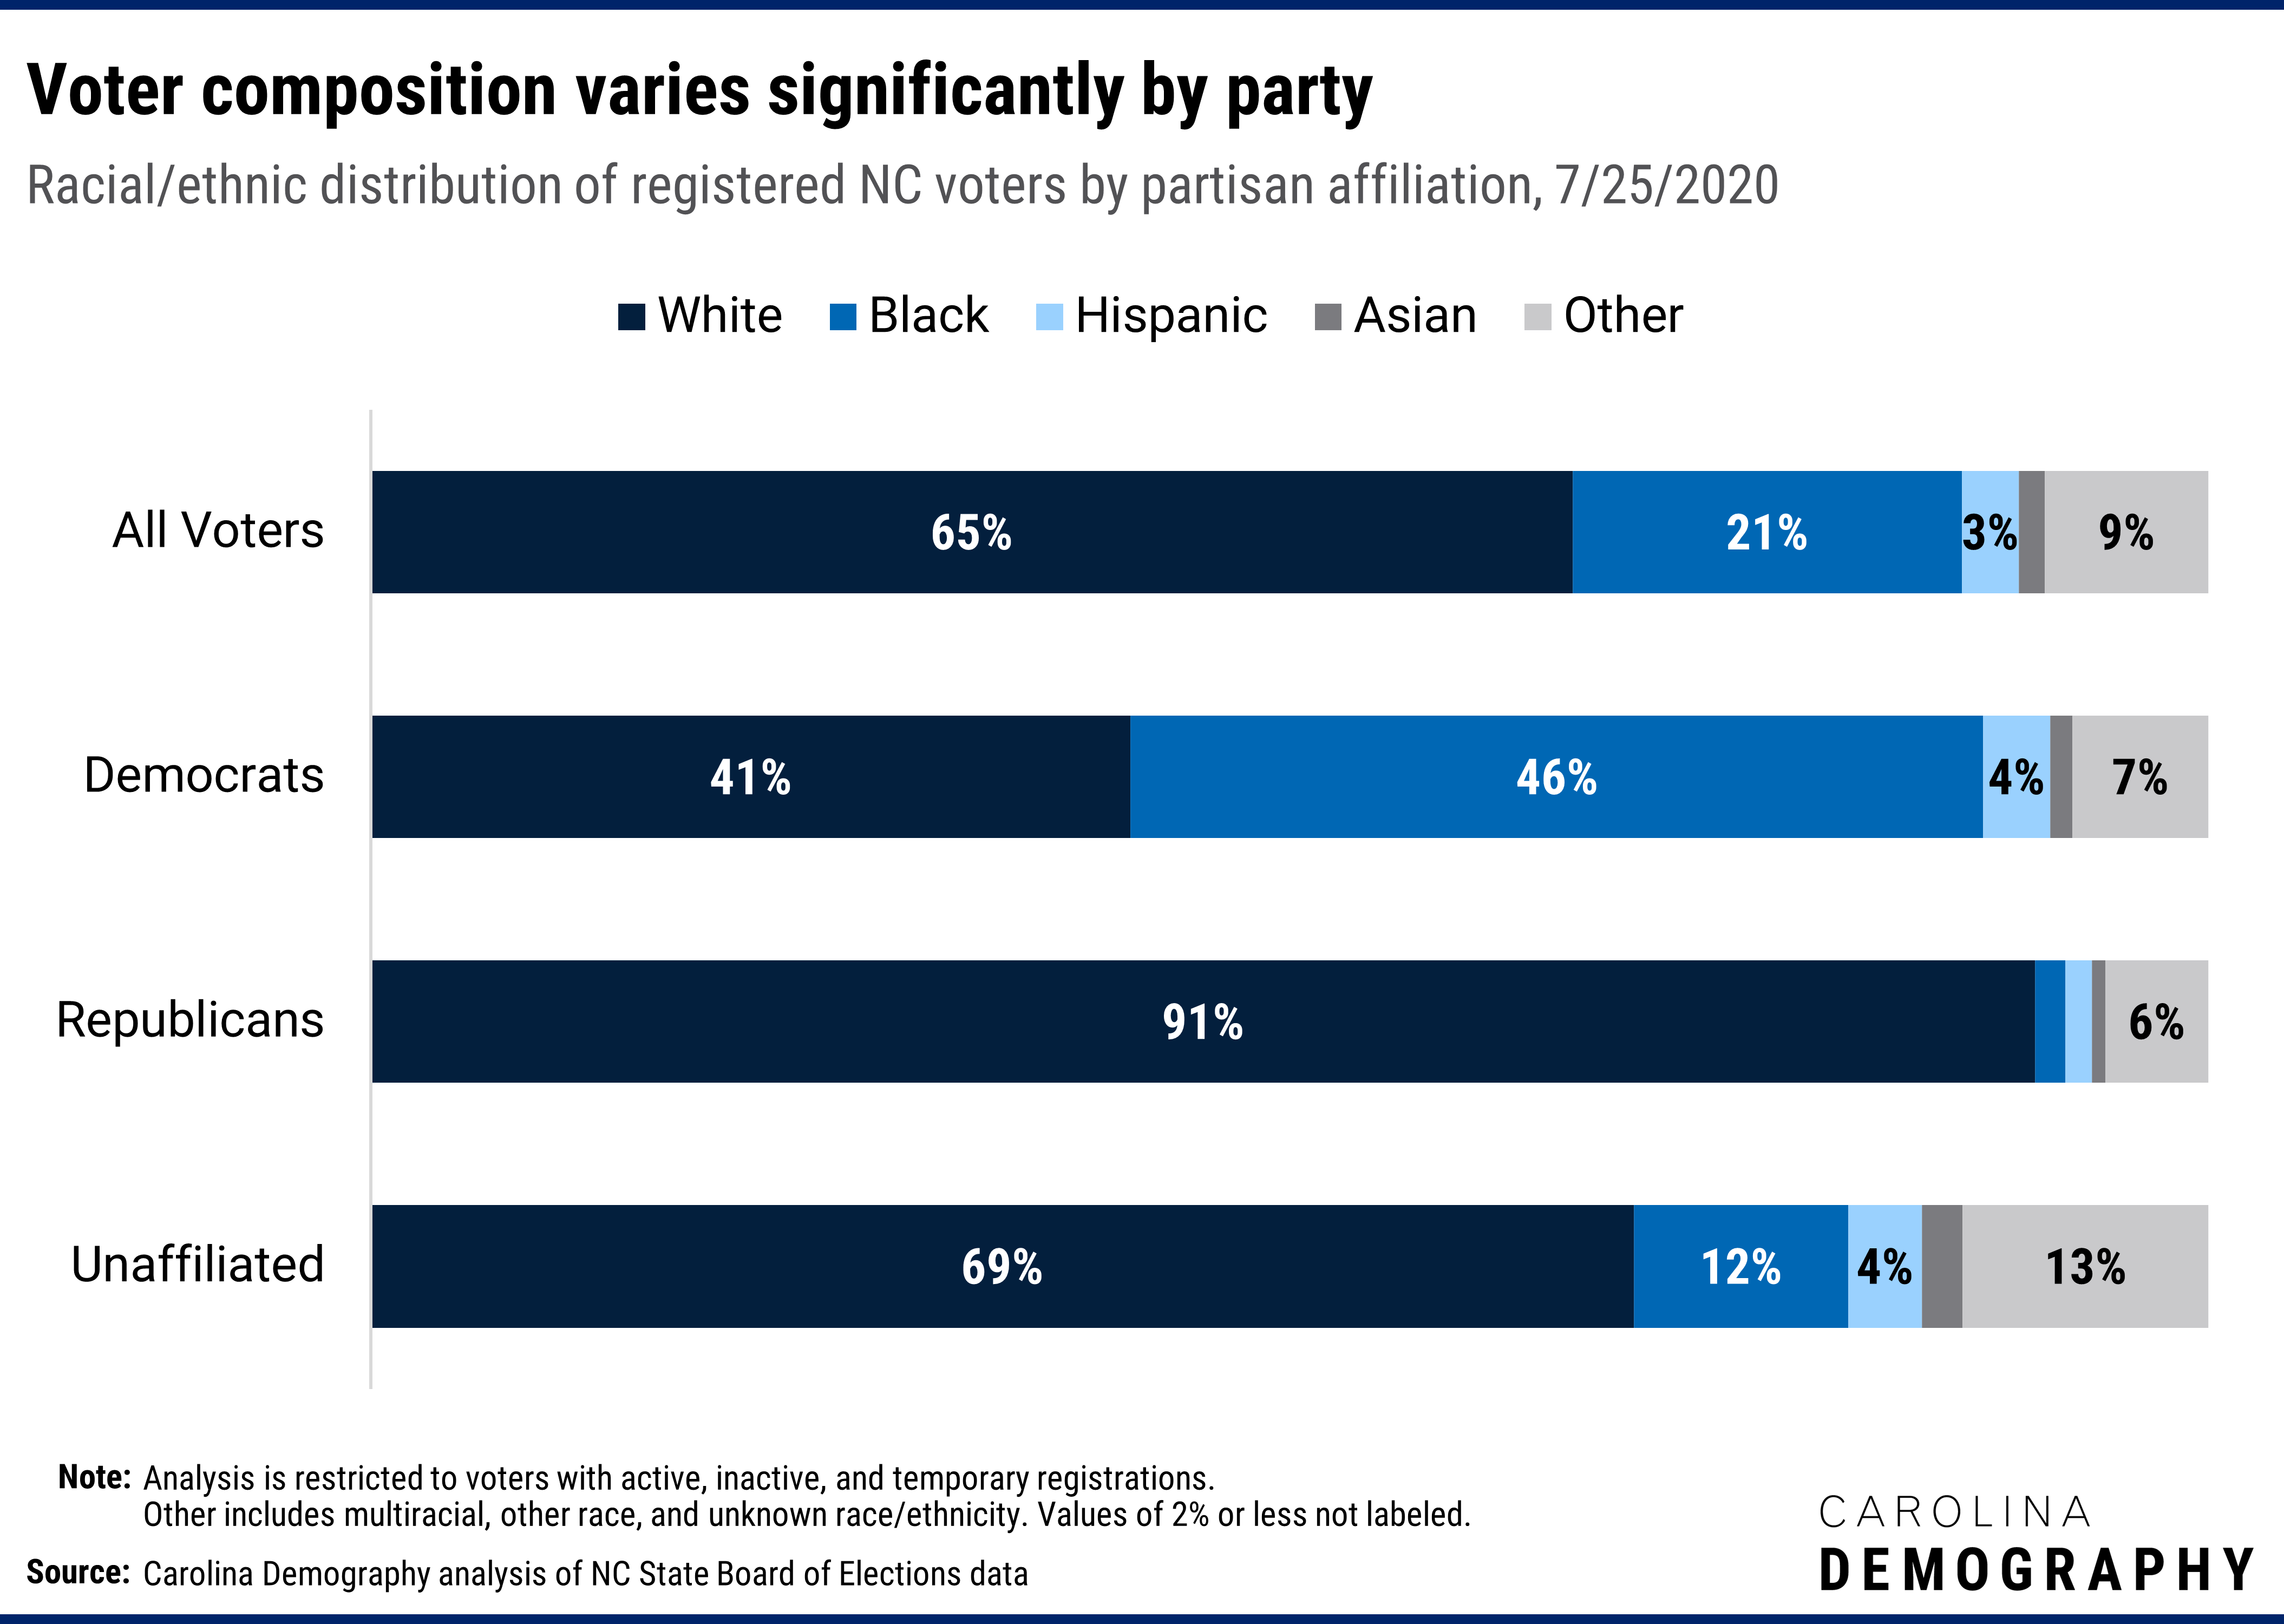
Unaffiliated voters are more diverse, with higher shares of Hispanic (4%) and Asian (2%) voters than the electorate overall. The high shares of “Other” race voters among unaffiliated registrants (13%) largely reflects increases in the share of recently registered voters who do not report a race or ethnic identification on their voter registration form.
More than two in every five (41%) of registered voters in North Carolina was born in the state. Another 16% did not report a place of birth. New York (6%), other countries (4%), and Virginia (3%) were the next most common places of birth.
North Carolina-born voters were more common among registered Democrats (45%) and Republicans (44%); unaffiliated voters were less likely to be born in North Carolina (35%) than the average registered voter.
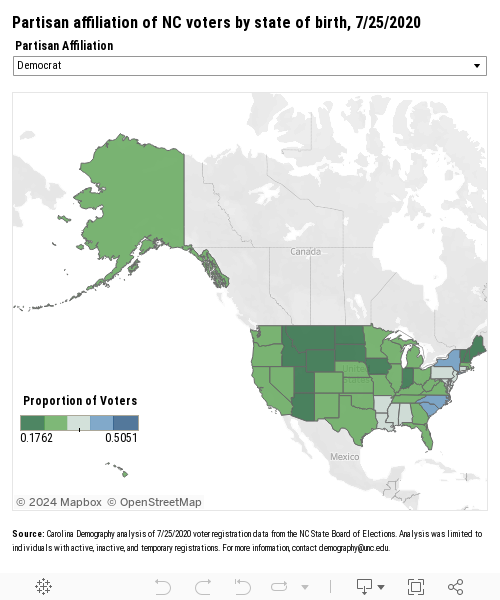
Party preferences vary by place of birth with some regional patterns evident. DC and Carolina-born voters were most likely to register as Democrats: 51% of voters born in DC are registered as Democrats, the highest of any state of birth, followed by South Carolina (42%) and North Carolina (39%) born voters.
Midwestern-born voters were most likely to register as Republican: 40% of West Virginia-born voters are registered Republican, followed by South Dakota (40%), Kentucky (39%), Oklahoma (37%), Indiana (37%), and Nebraska (37%).
Northeastern-born voters, meanwhile, were most likely to register unaffiliated. Nearly half—49%—of Rhode Island, New Hampshire, and Massachusetts-born voters registered as unaffiliated, followed by Vermont (47%).
Across North Carolina’s 100 counties, the partisan affiliation of voters varies widely, reflecting county differences in composition by age, race/ethnicity, and place of birth. Voters in western counties are generally more likely to be registered Republican, for example, while those in northeastern counties are more likely to be registered Democrat.
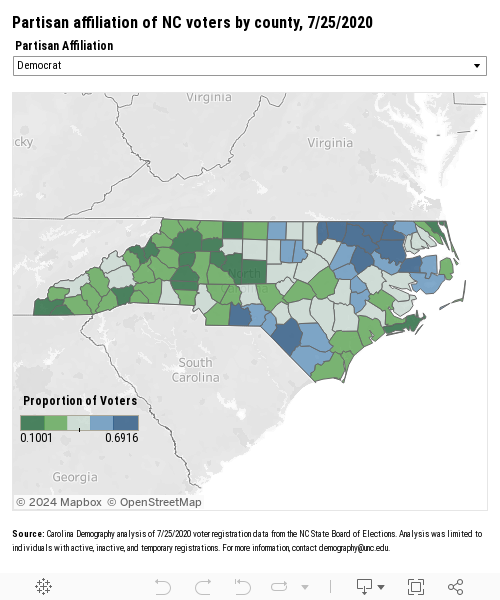
Sixty percent of active voters in Mitchell County were registered Republican, the highest rate statewide. Mitchell also had the lowest rate of registered Democratic voters. In Hertford County, meanwhile, 69% of voters are registered Democrat, the highest rate statewide; Hertford also had the lowest rate of registered Republican voters
There are less clear regional patterns in unaffiliated registrations. The top 10 counties for unaffiliated voters include:
Note: analysis presented is of the 7/25/2020 voter registration file from NC’s State Board of Elections. Analysis is limited to individuals who are active, inactive, or temporary registered voters. Voters with reported birth age of 116 years or older were excluded from the age analysis. Voters with registration dates prior to 1930 were excluded from the registration date analysis.
Need help understanding population change and its impacts on your community or business? Carolina Demography offers demographic research tailored to your needs.
Contact us today for a free initial consultation.
Contact UsCategories: Elections & Voting, NC in Focus

The Center for Women’s Health Research (CWHR) at the University of North Carolina School of Medicine released the 12th edition of our North Carolina Women’s Health Report Card on May 9, 2022. This document is a progress report on the…

Dr. Krista Perreira is a health economist who studies disparities in health, education, and economic well-being. In collaboration with the Urban Institute, she recently co-led a study funded by the Kate B. Reynolds Foundation to study barriers to access to…

Our material helped the NC Local News Lab Fund better understand and then prioritize their funding to better serve existing and future grant recipients in North Carolina. The North Carolina Local News Lab Fund was established in 2017 to strengthen…
Your support is critical to our mission of measuring, understanding, and predicting population change and its impact. Donate to Carolina Demography today.