Active-duty military personnel and veterans have a significant presence in North Carolina. North Carolina is home to two major military bases—Fort Bragg (Army) and Camp Lejeune (Marine Corps)—in addition to two Marine Corps Air Stations at New River and Cherry Point and Seymour Johnson Air Force Base. As a result, more North Carolina adults are veterans than the national average: 7.9% versus 6.9% nationwide.
In 2019, nearly 642,000 veterans lived in North Carolina according to the most recent American Community Survey estimates, a decrease of 25,000 veterans from 2018. Nationally, the veteran population continued to decrease, declining to 17.4 million from just under 18 million in 2018. The likely cause of the overall veteran population decline is mortality, as veterans who served in World War II, Korea, and even Vietnam advance in age.
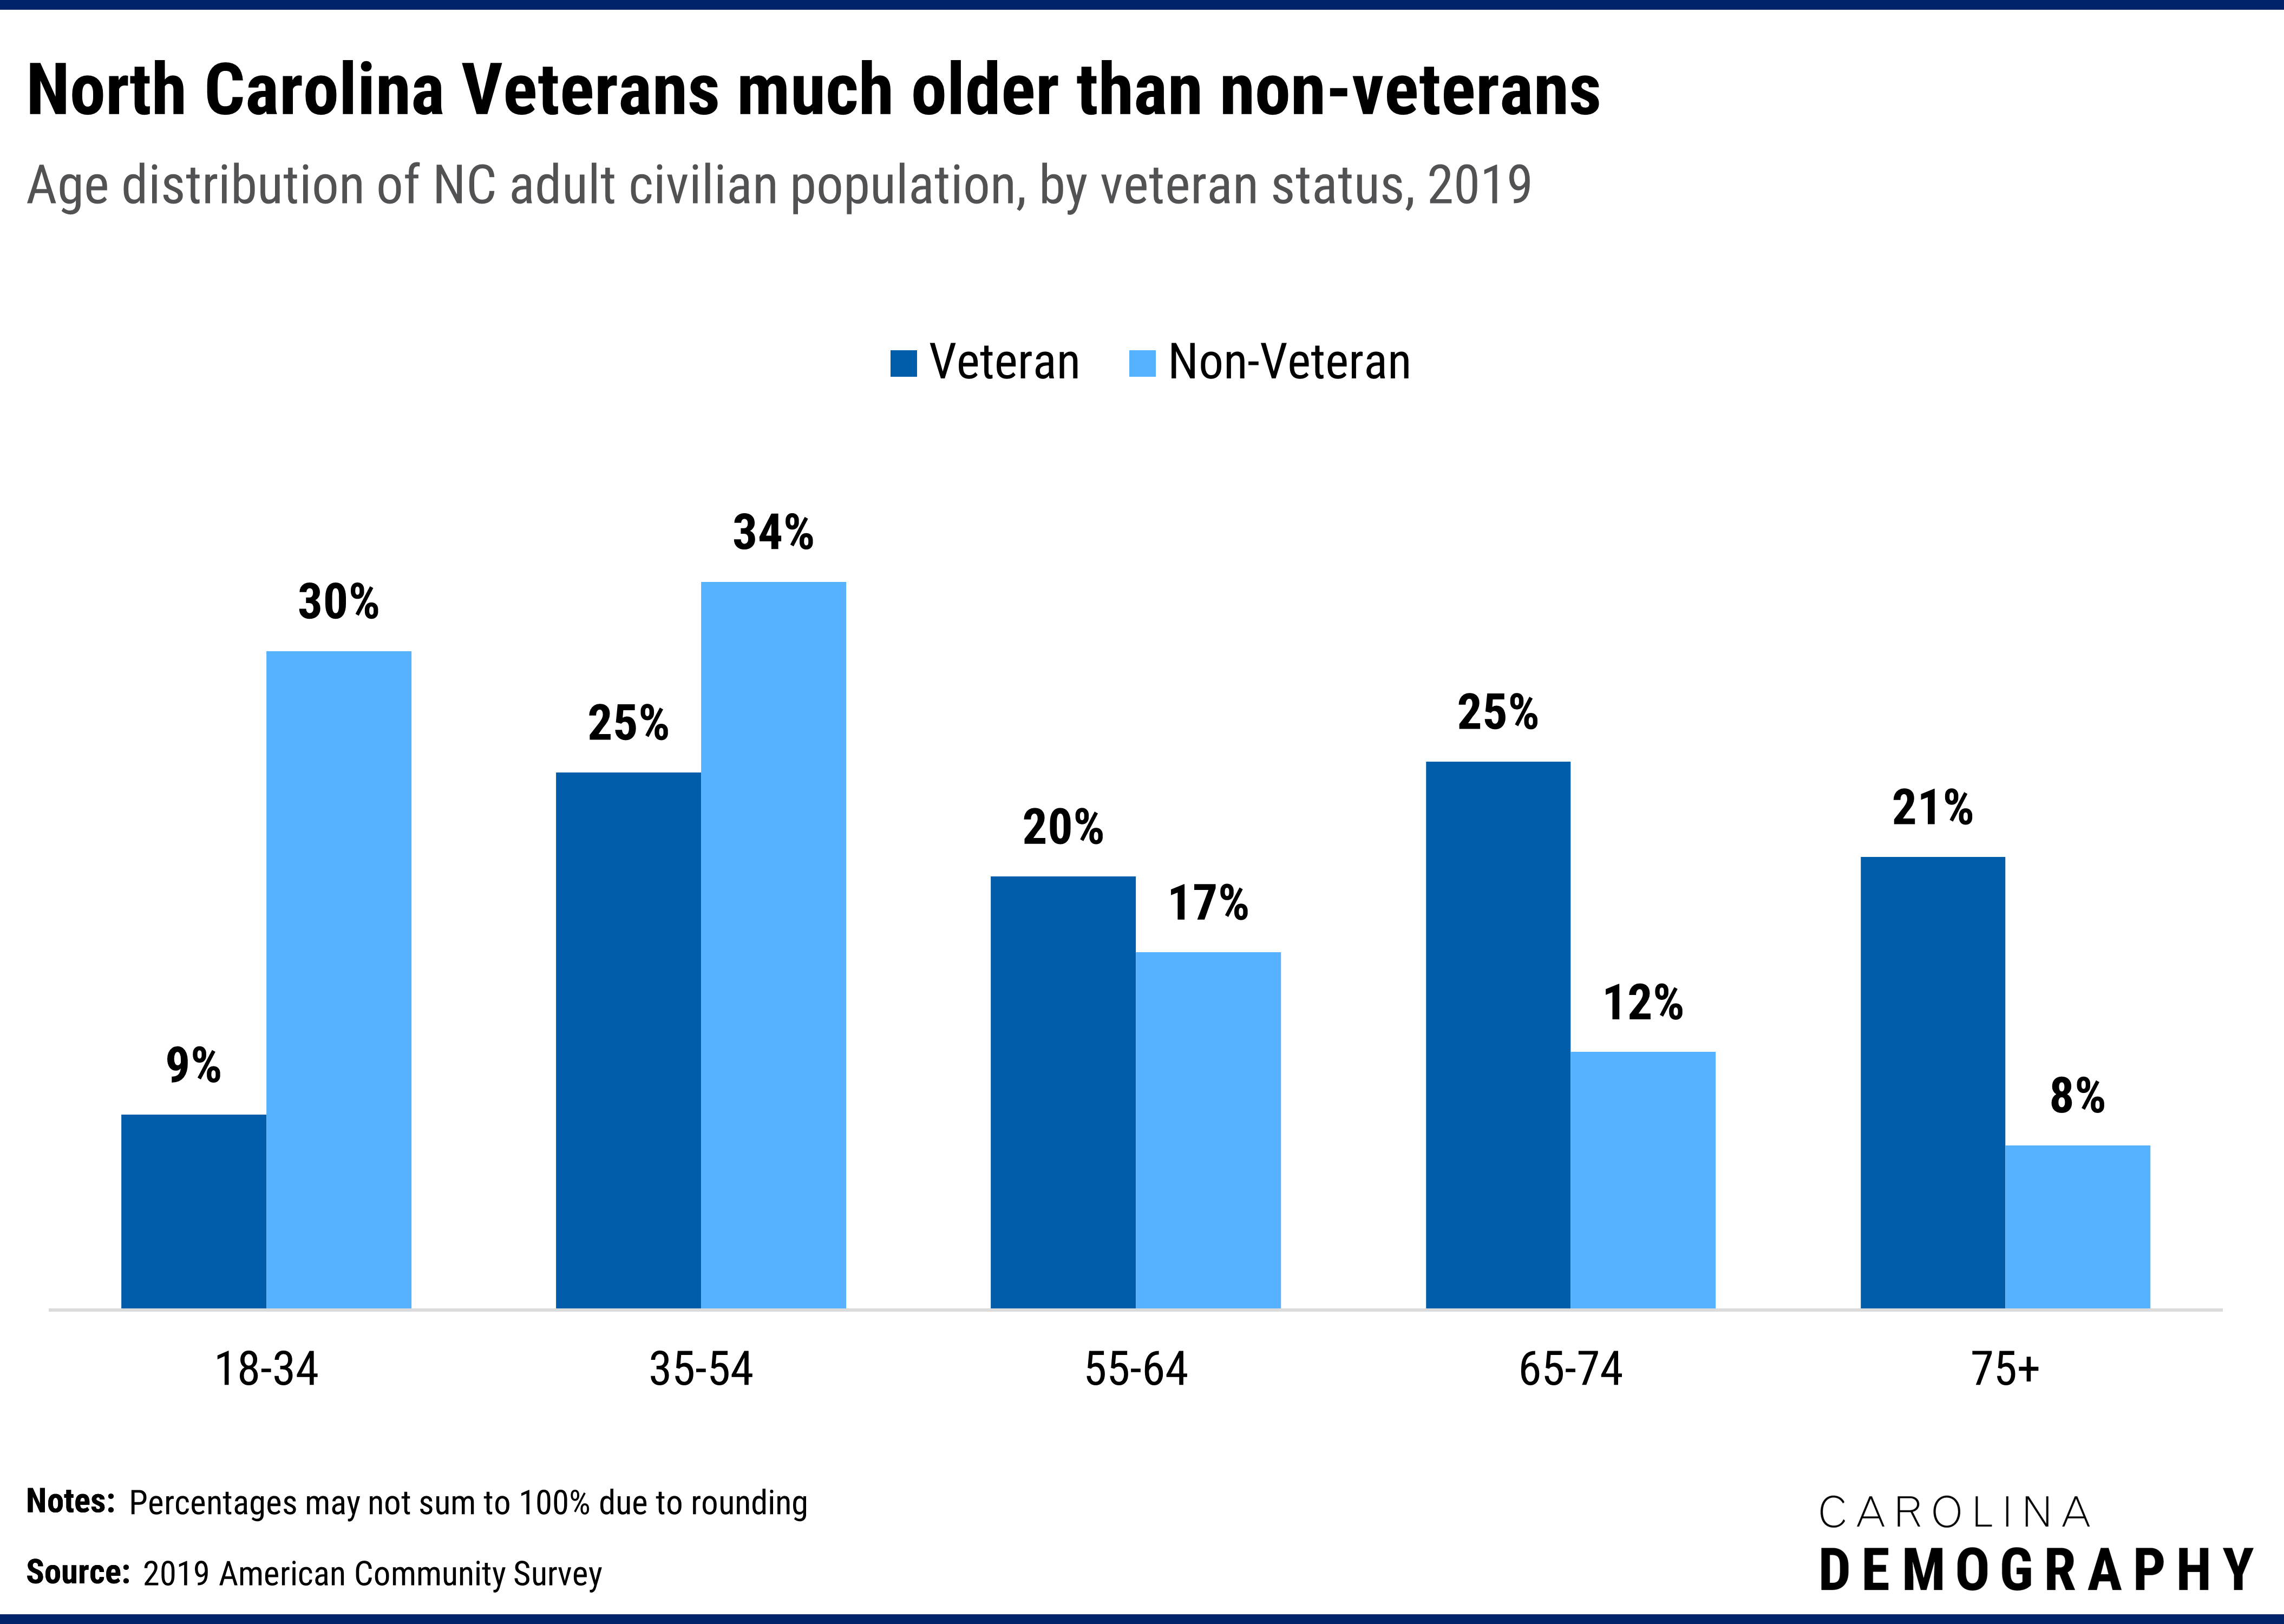
North Carolina’s veterans are much older, on average, then the non-veteran adult population. Forty-five percent (46%) of NC veterans are 65 or older compared to just 20% of non-veteran adults. Just 9% of the state’s veterans are between the ages of 18 and 34, less than one-third the share of non-veterans (30%) in this age group.
Reflecting this older age structure, North Carolina veterans are nearly twice as likely to have a disability than non-veterans. Thirty percent (30%) of the state’s veterans reported a disability in 2019 compared to 16% of the state’s non-veterans.
Most veterans in North Carolina are male. Just over one in every ten veterans in the state (10.6%) was female in 2019, higher than the national average of 9.4%.
The veteran population is somewhat less diverse than the state’s overall adult population, reflecting the relatively older age structure. Among North Carolina’s veterans in 2019:
1.2% are some other race or multiracial vs. 1.4% of non-veterans.
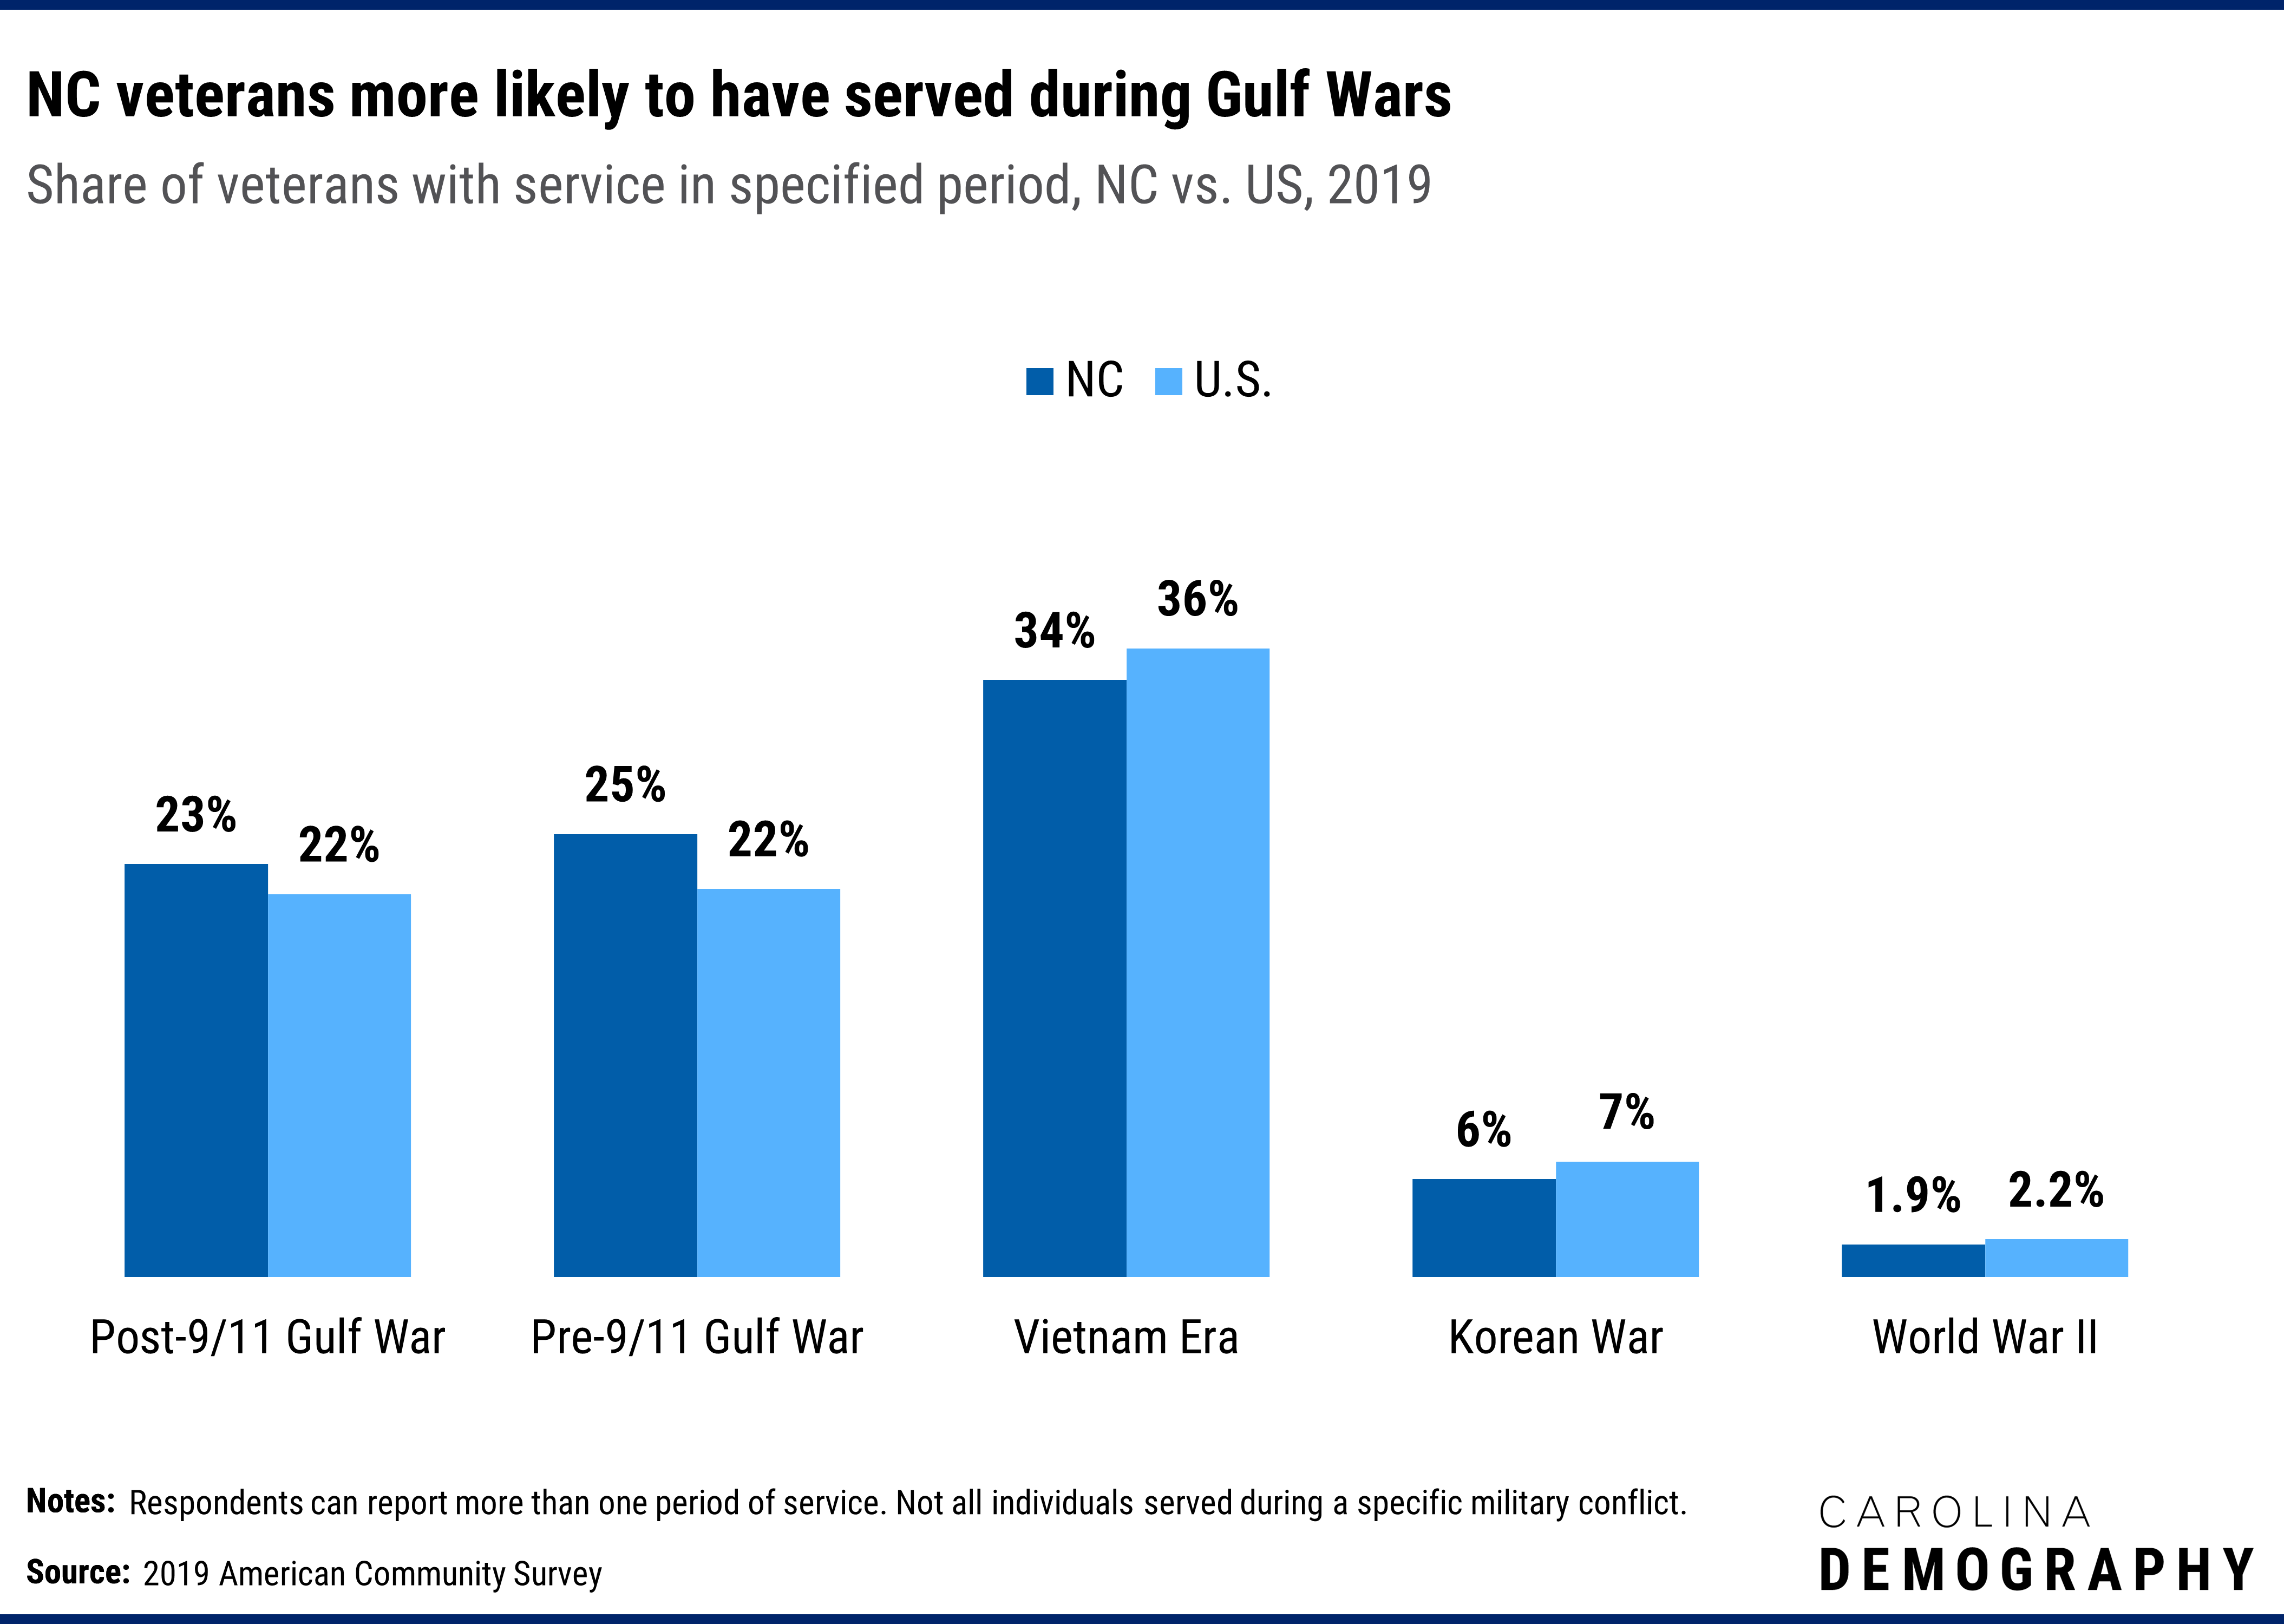
In North Carolina, like the nation, the largest share of veterans served during the Vietnam era: 36% in North Carolina and 34% nationwide. Compared to the national average, North Carolina’s veterans were more likely to report service in either of the Gulf Wars and less likely to have served during the Korean War or World War II.
Compared to their non-veteran peers, North Carolina veterans of prime working age (18-64) were less likely to be in the labor force: 72.4% NC veterans were in the labor force in 2019 compared to 75.7% of non-veterans.
Among those in the labor force, North Carolina’s veterans were less likely to be unemployed: 3.1% of veterans aged 18-64 were unemployed in 2019 compared to 4.6% of non-veterans.
North Carolina’s veterans had higher median incomes than the non-veteran population. Among the population receiving income, the median veteran income in 2019 was $41,346, more than $11,300 or 38% higher than the median non-veteran income of $30,034.
Reflecting these higher incomes, North Carolina’s veterans were much less likely to be in poverty than non-veterans. Seven percent of the state’s veteran population had incomes below the poverty line in 2019, more than five percentage points below the poverty rate of the state’s non-veteran adult population (12.4%).
Though non-veterans are more likely to hold a bachelor’s degree or higher (33% vs. 29% of veterans), North Carolina’s veterans are more likely to have attended some college or received an associate degree (39% vs. 30%). In total, 68% of North Carolina veterans have some college or a postsecondary degree compared to 62% of non-veterans.
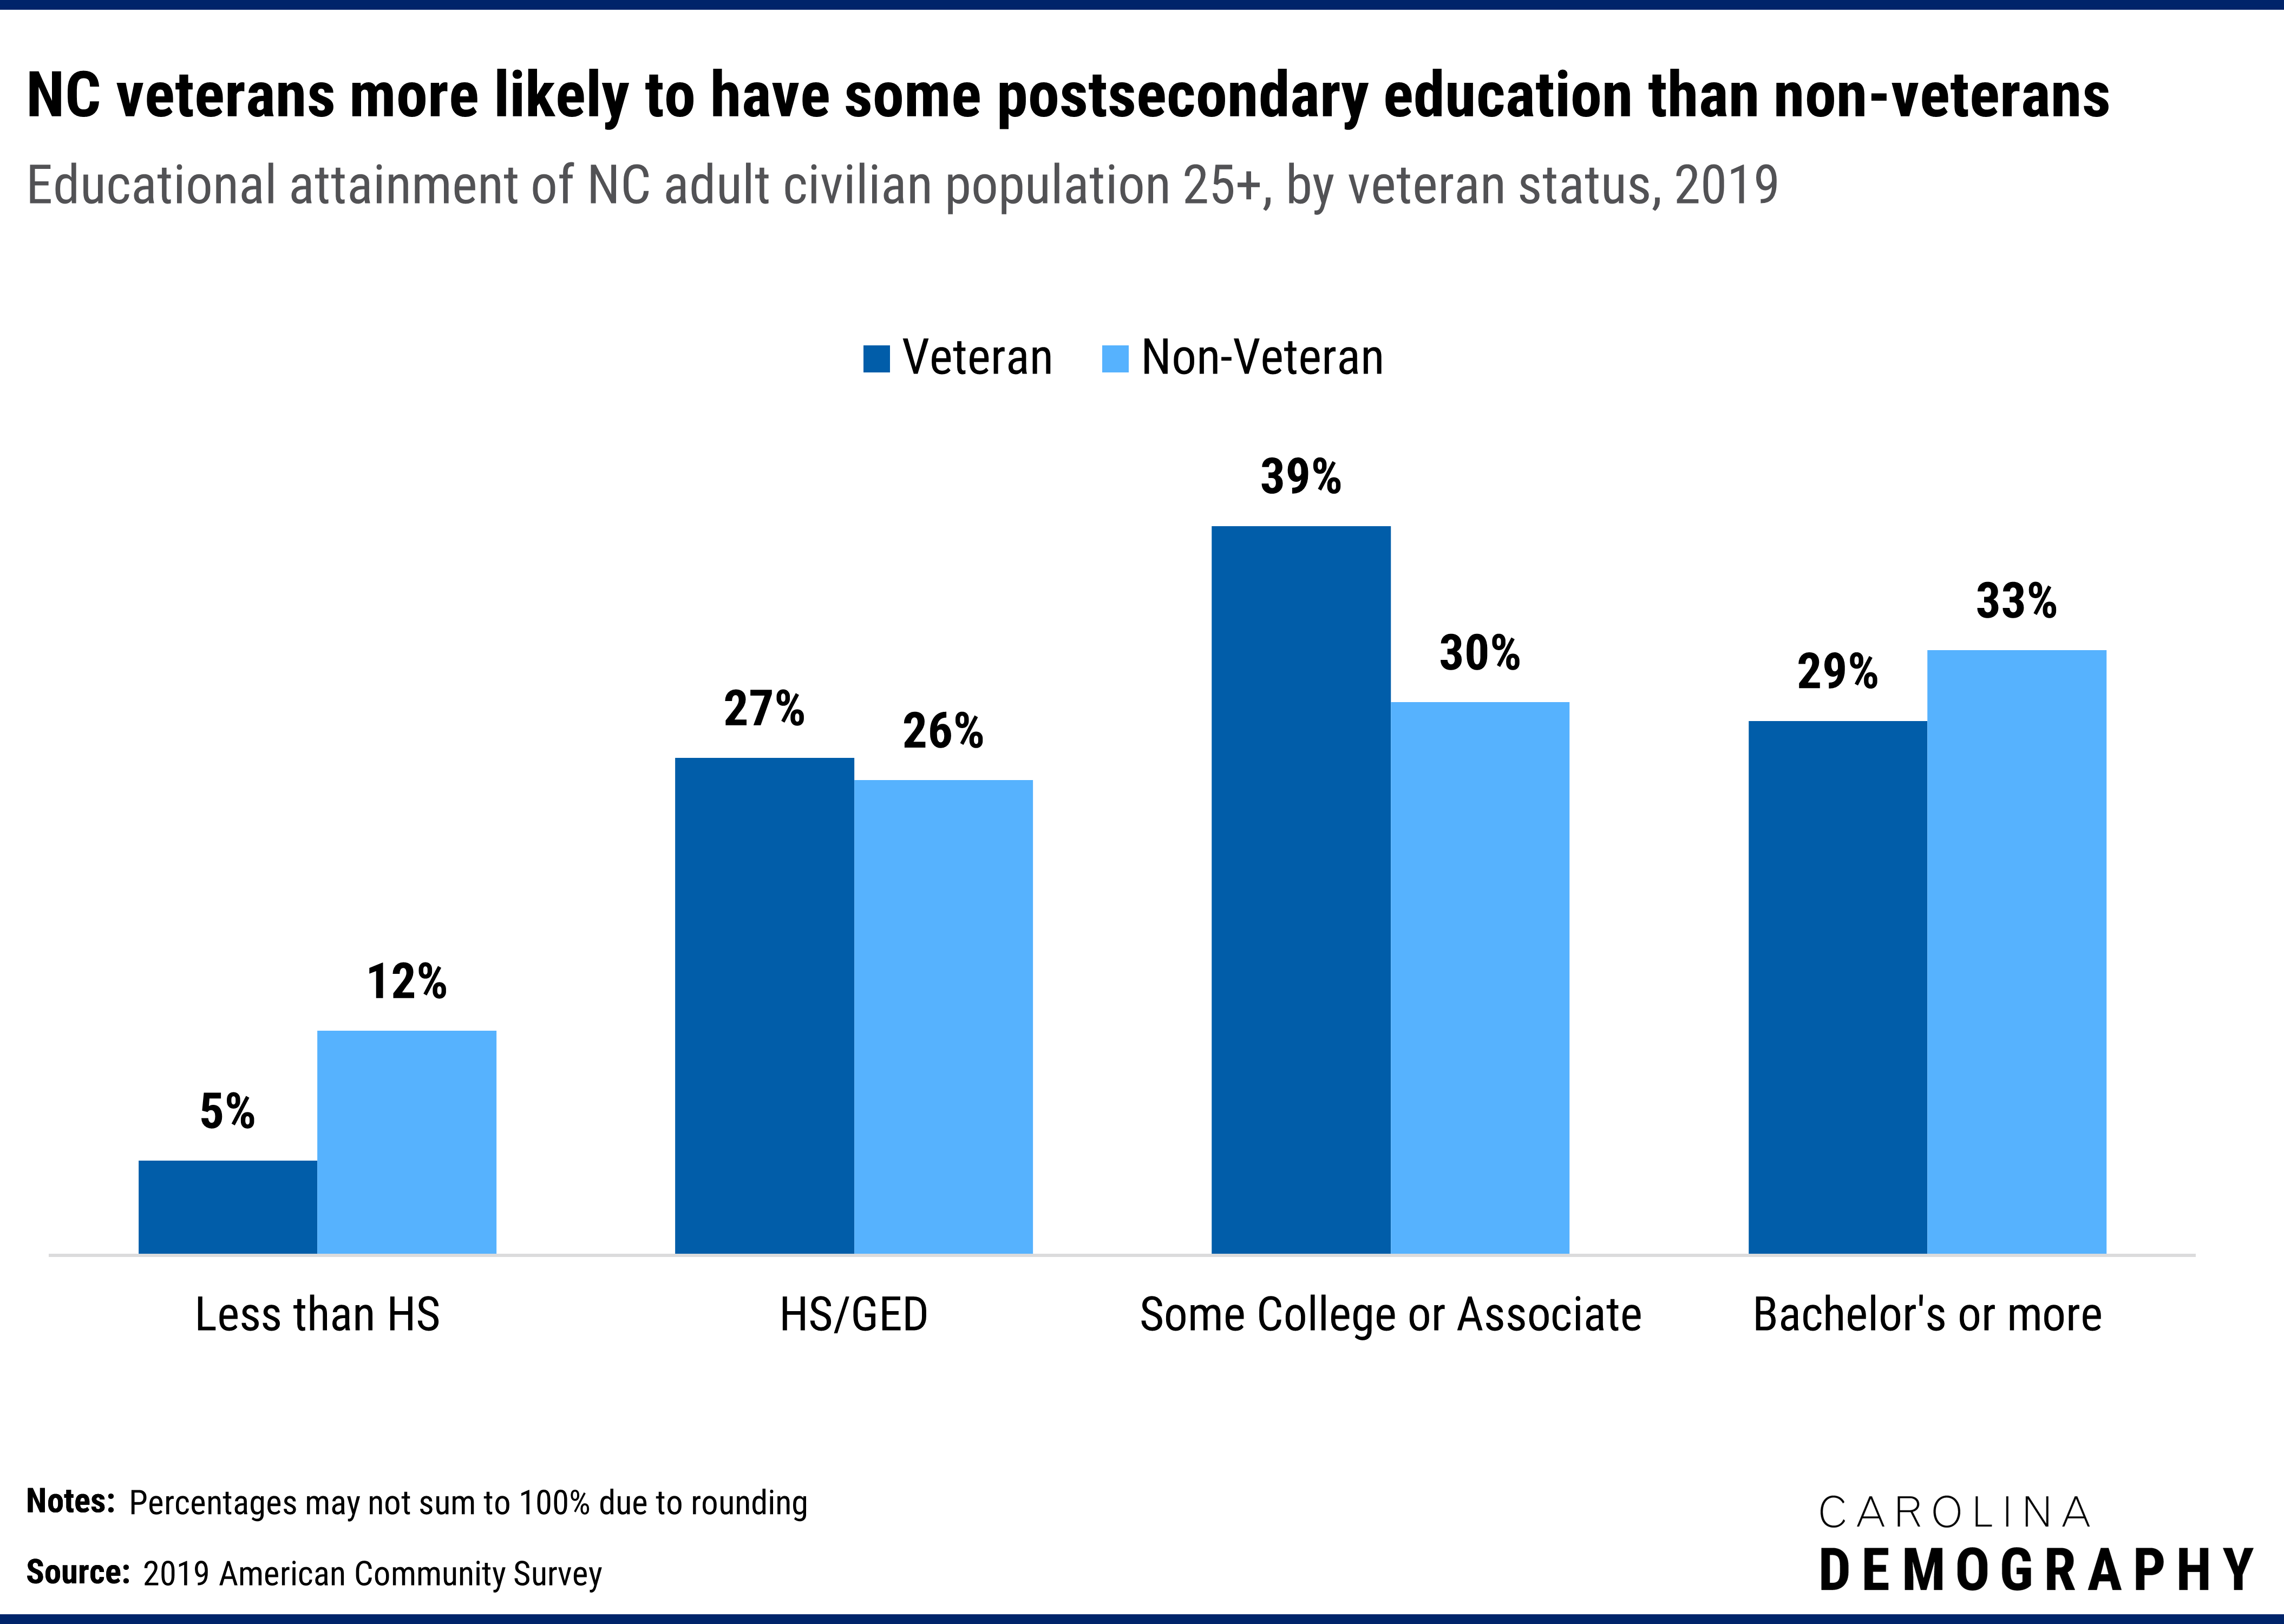
Veterans are also more likely than non-veterans to have completed high school: 5% of NC veterans reported having less than a high school diploma in 2019 versus 12% of non-veterans.
Need help understanding population change and its impacts on your community or business? Carolina Demography offers demographic research tailored to your needs.
Contact us today for a free initial consultation.
Contact UsCategories: NC in Focus
Tags: veterans

The Center for Women’s Health Research (CWHR) at the University of North Carolina School of Medicine released the 12th edition of our North Carolina Women’s Health Report Card on May 9, 2022. This document is a progress report on the…

Dr. Krista Perreira is a health economist who studies disparities in health, education, and economic well-being. In collaboration with the Urban Institute, she recently co-led a study funded by the Kate B. Reynolds Foundation to study barriers to access to…

Our material helped the NC Local News Lab Fund better understand and then prioritize their funding to better serve existing and future grant recipients in North Carolina. The North Carolina Local News Lab Fund was established in 2017 to strengthen…
Your support is critical to our mission of measuring, understanding, and predicting population change and its impact. Donate to Carolina Demography today.