It’s been nearly a year since our lives were first disrupted by the global COVID-19 pandemic. What do cumulative case counts, deaths, and vaccination levels look like in North Carolina? Here’s the latest data according to NC DHHS data accessed on 2/11/2021. I used the projected 2020 population from the state demographer to calculate levels per 10,000 residents.
There have been 805,889 cases recorded in North Carolina counties or 758 per 10,000 residents. Total COVID cases per 10,000 were highest in Hyde County (1,179), followed by Robeson (1,064), Catawba (1,034), and Montgomery (1,030). The largest cluster of counties with high rates is in the western foothills region.
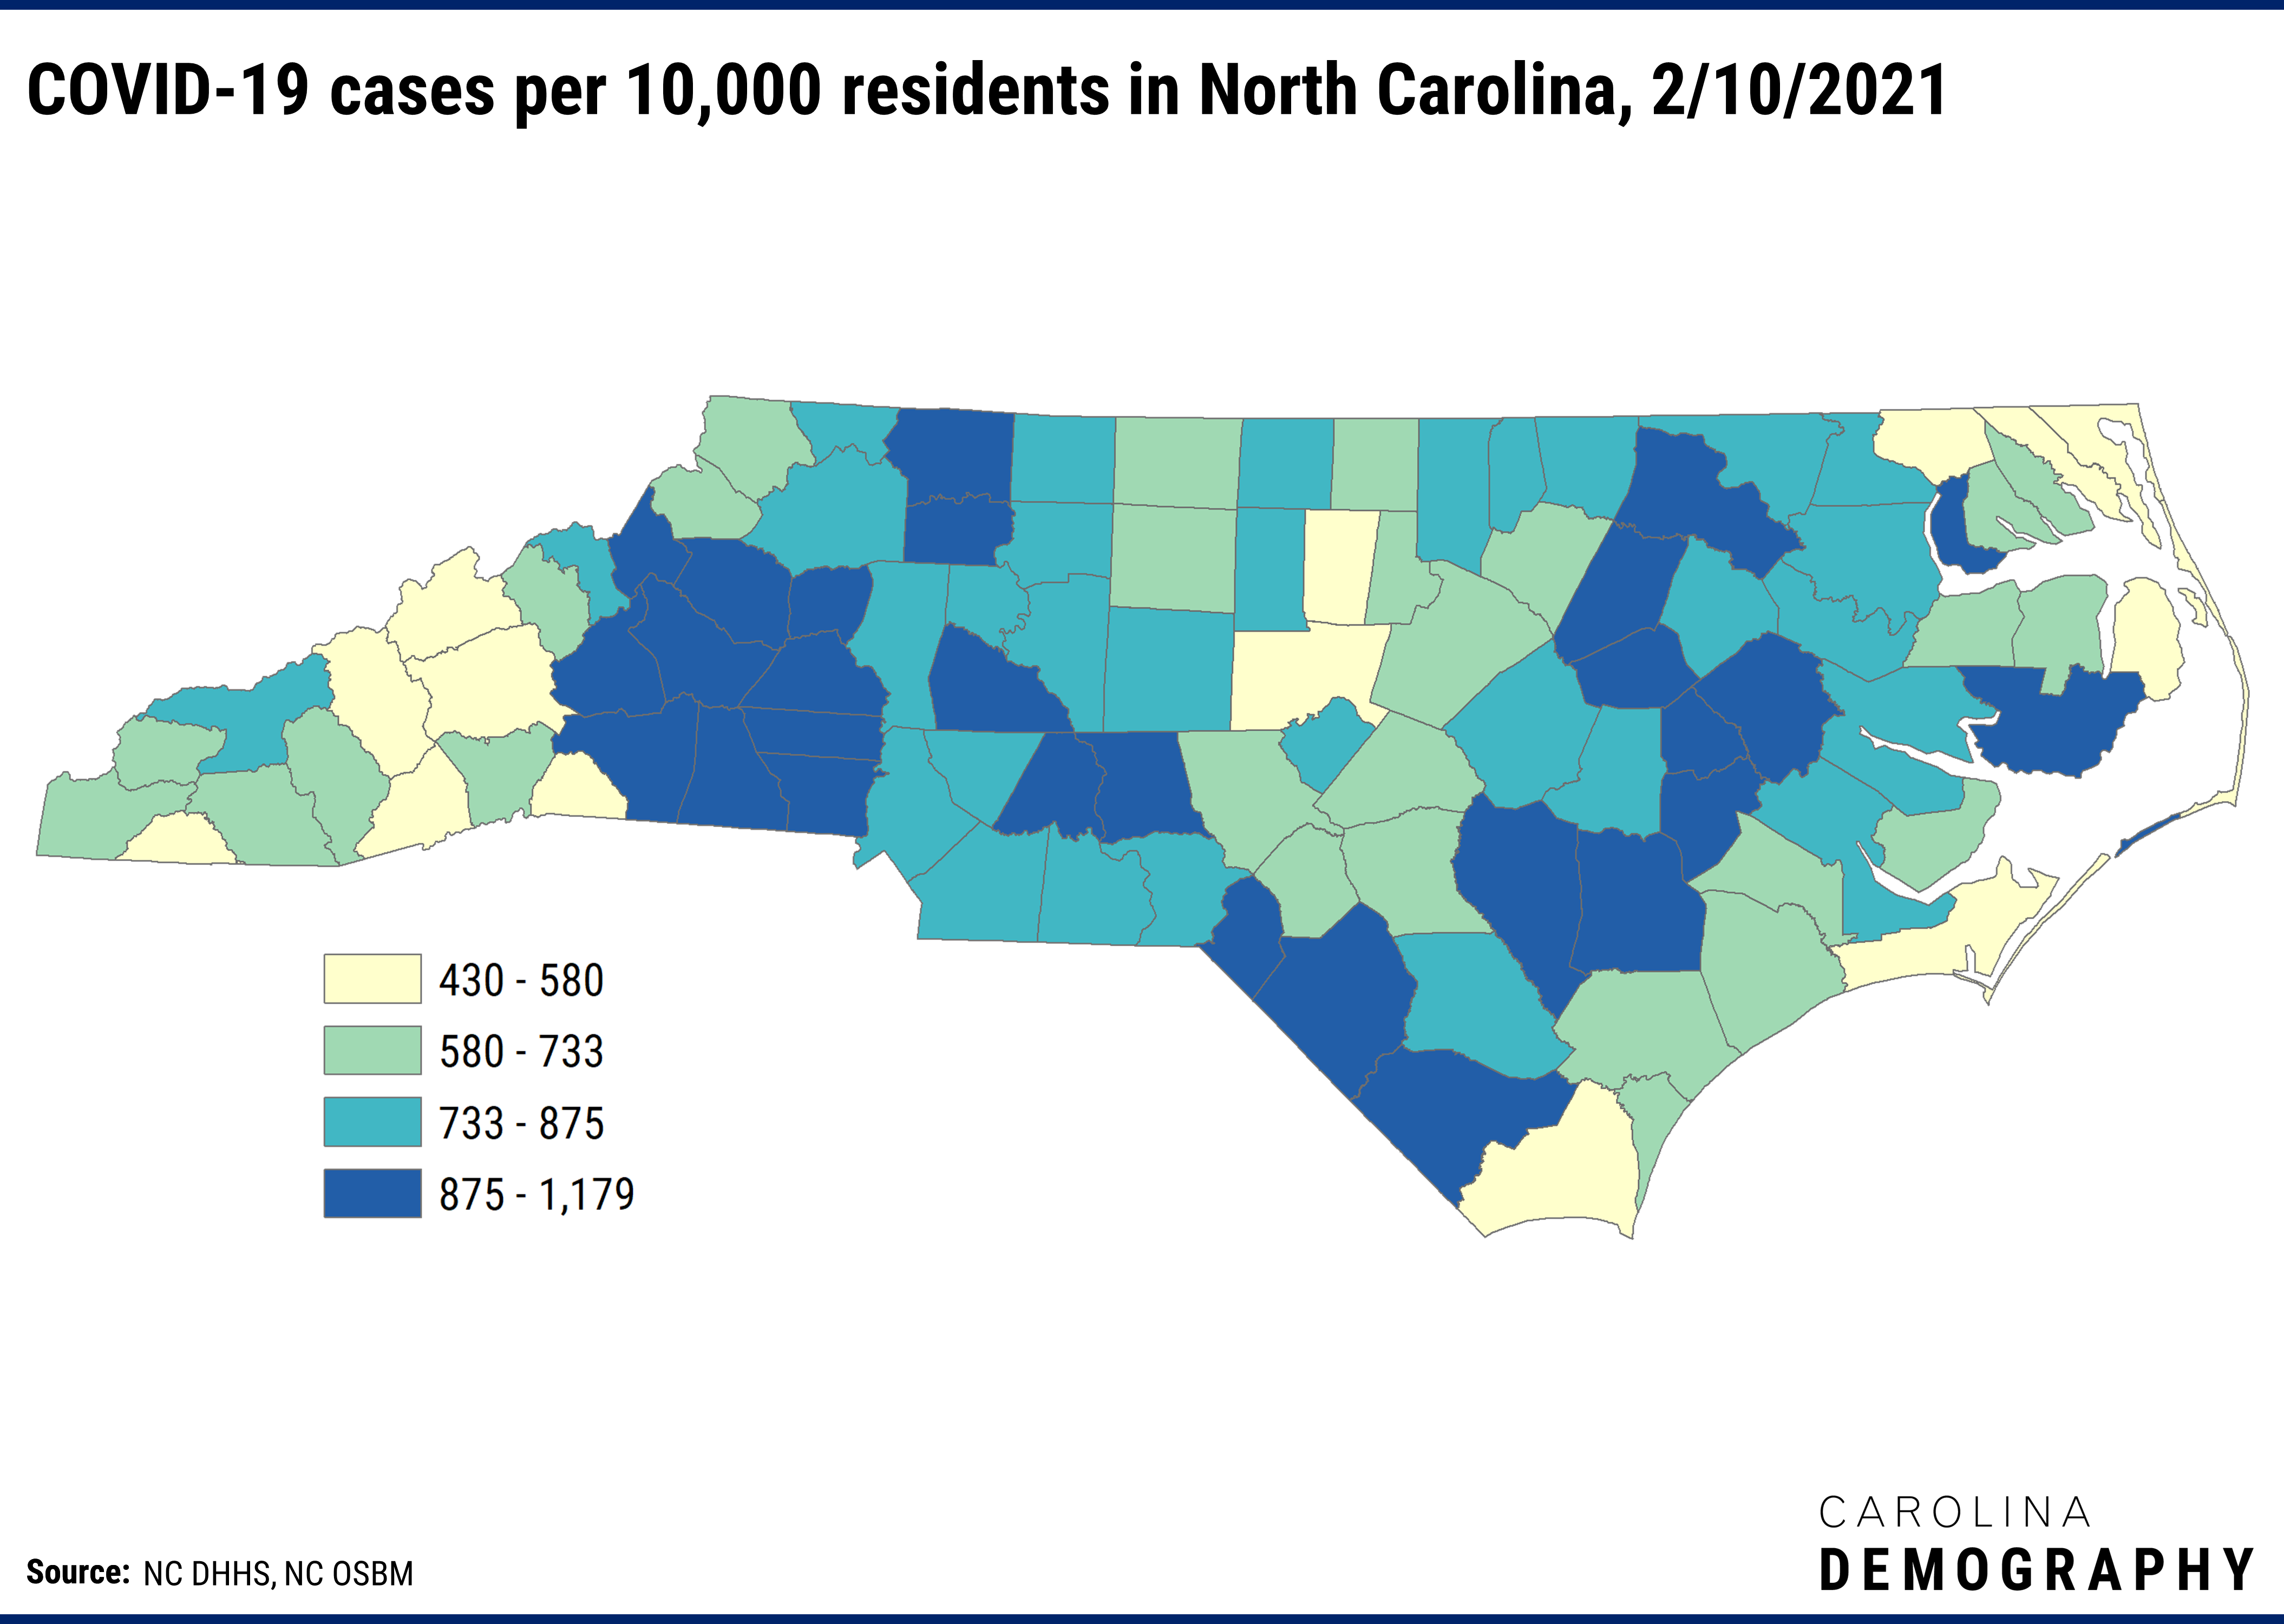
Counties with the lowest cumulative cases of COVID-19 include three coastal counties—Currituck (430 cases per 10,000), Camden (471), and Dare (473)—Transylvania (484) in the west and Orange County (486) in the Triangle.
There have been 10,181 deaths recorded in North Carolina counties or 9.6 per 10,000 residents. Total COVID deaths per 10,000 were highest in Montgomery County (27.8), followed by Rutherford (27.2), Columbus (23.5), and Hertford (23.3). The largest cluster of counties with high rates are in the Sandhills and northeast regions of the state.
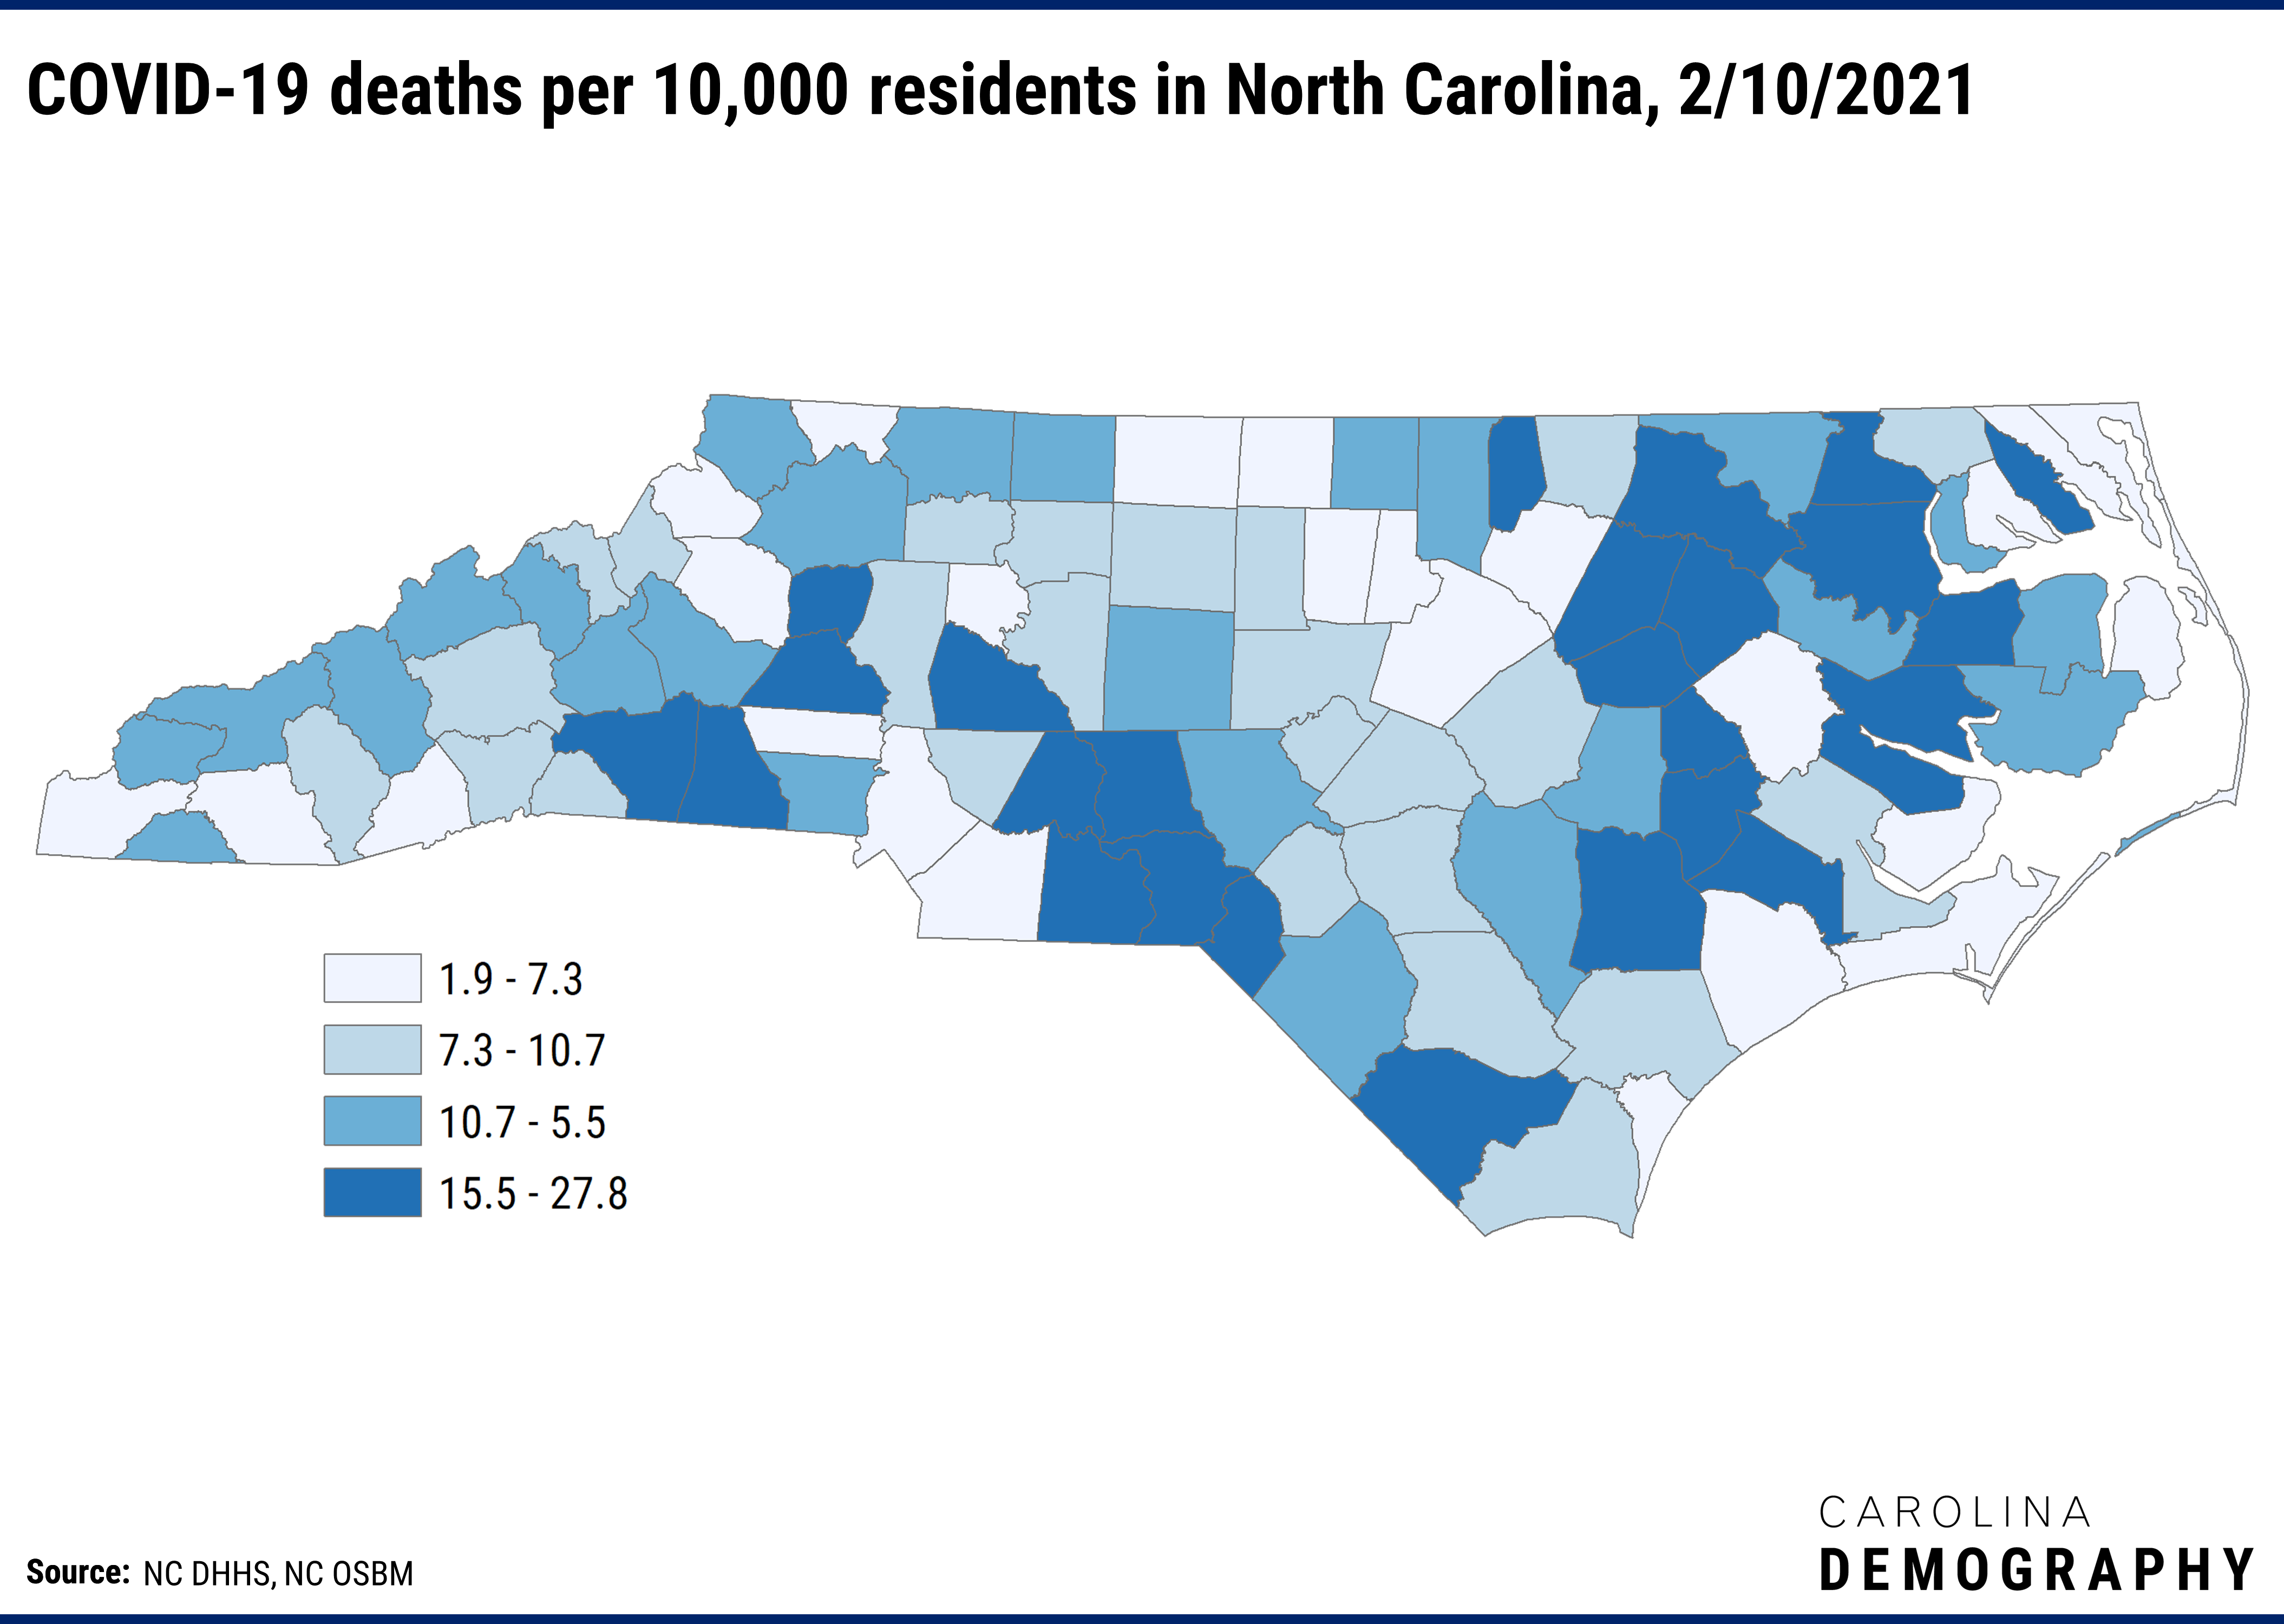
Counties with the lowest cumulative deaths from COVID-19 from 10,000 include Dare (1.9), Macon (3.3), Alleghany (3.5), Perquimans (3.7), and Pitt (4.0).
There have been 1,010,565 first doses of COVID-19 vaccine distributed to North Carolina counties or 1,216 per 10,000 adult residents – meaning about one in eight North Carolina adults have received their first dose of vaccine.
Vaccinations per 10,000 adults were highest in Chowan County (3,042), followed by Pasquotank (2,524), Dare (2,480), Perquimans (2,443), and Bertie (2,337). The largest cluster of counties with high vaccination rates are in the northeast/Outer Banks and near the Triangle.
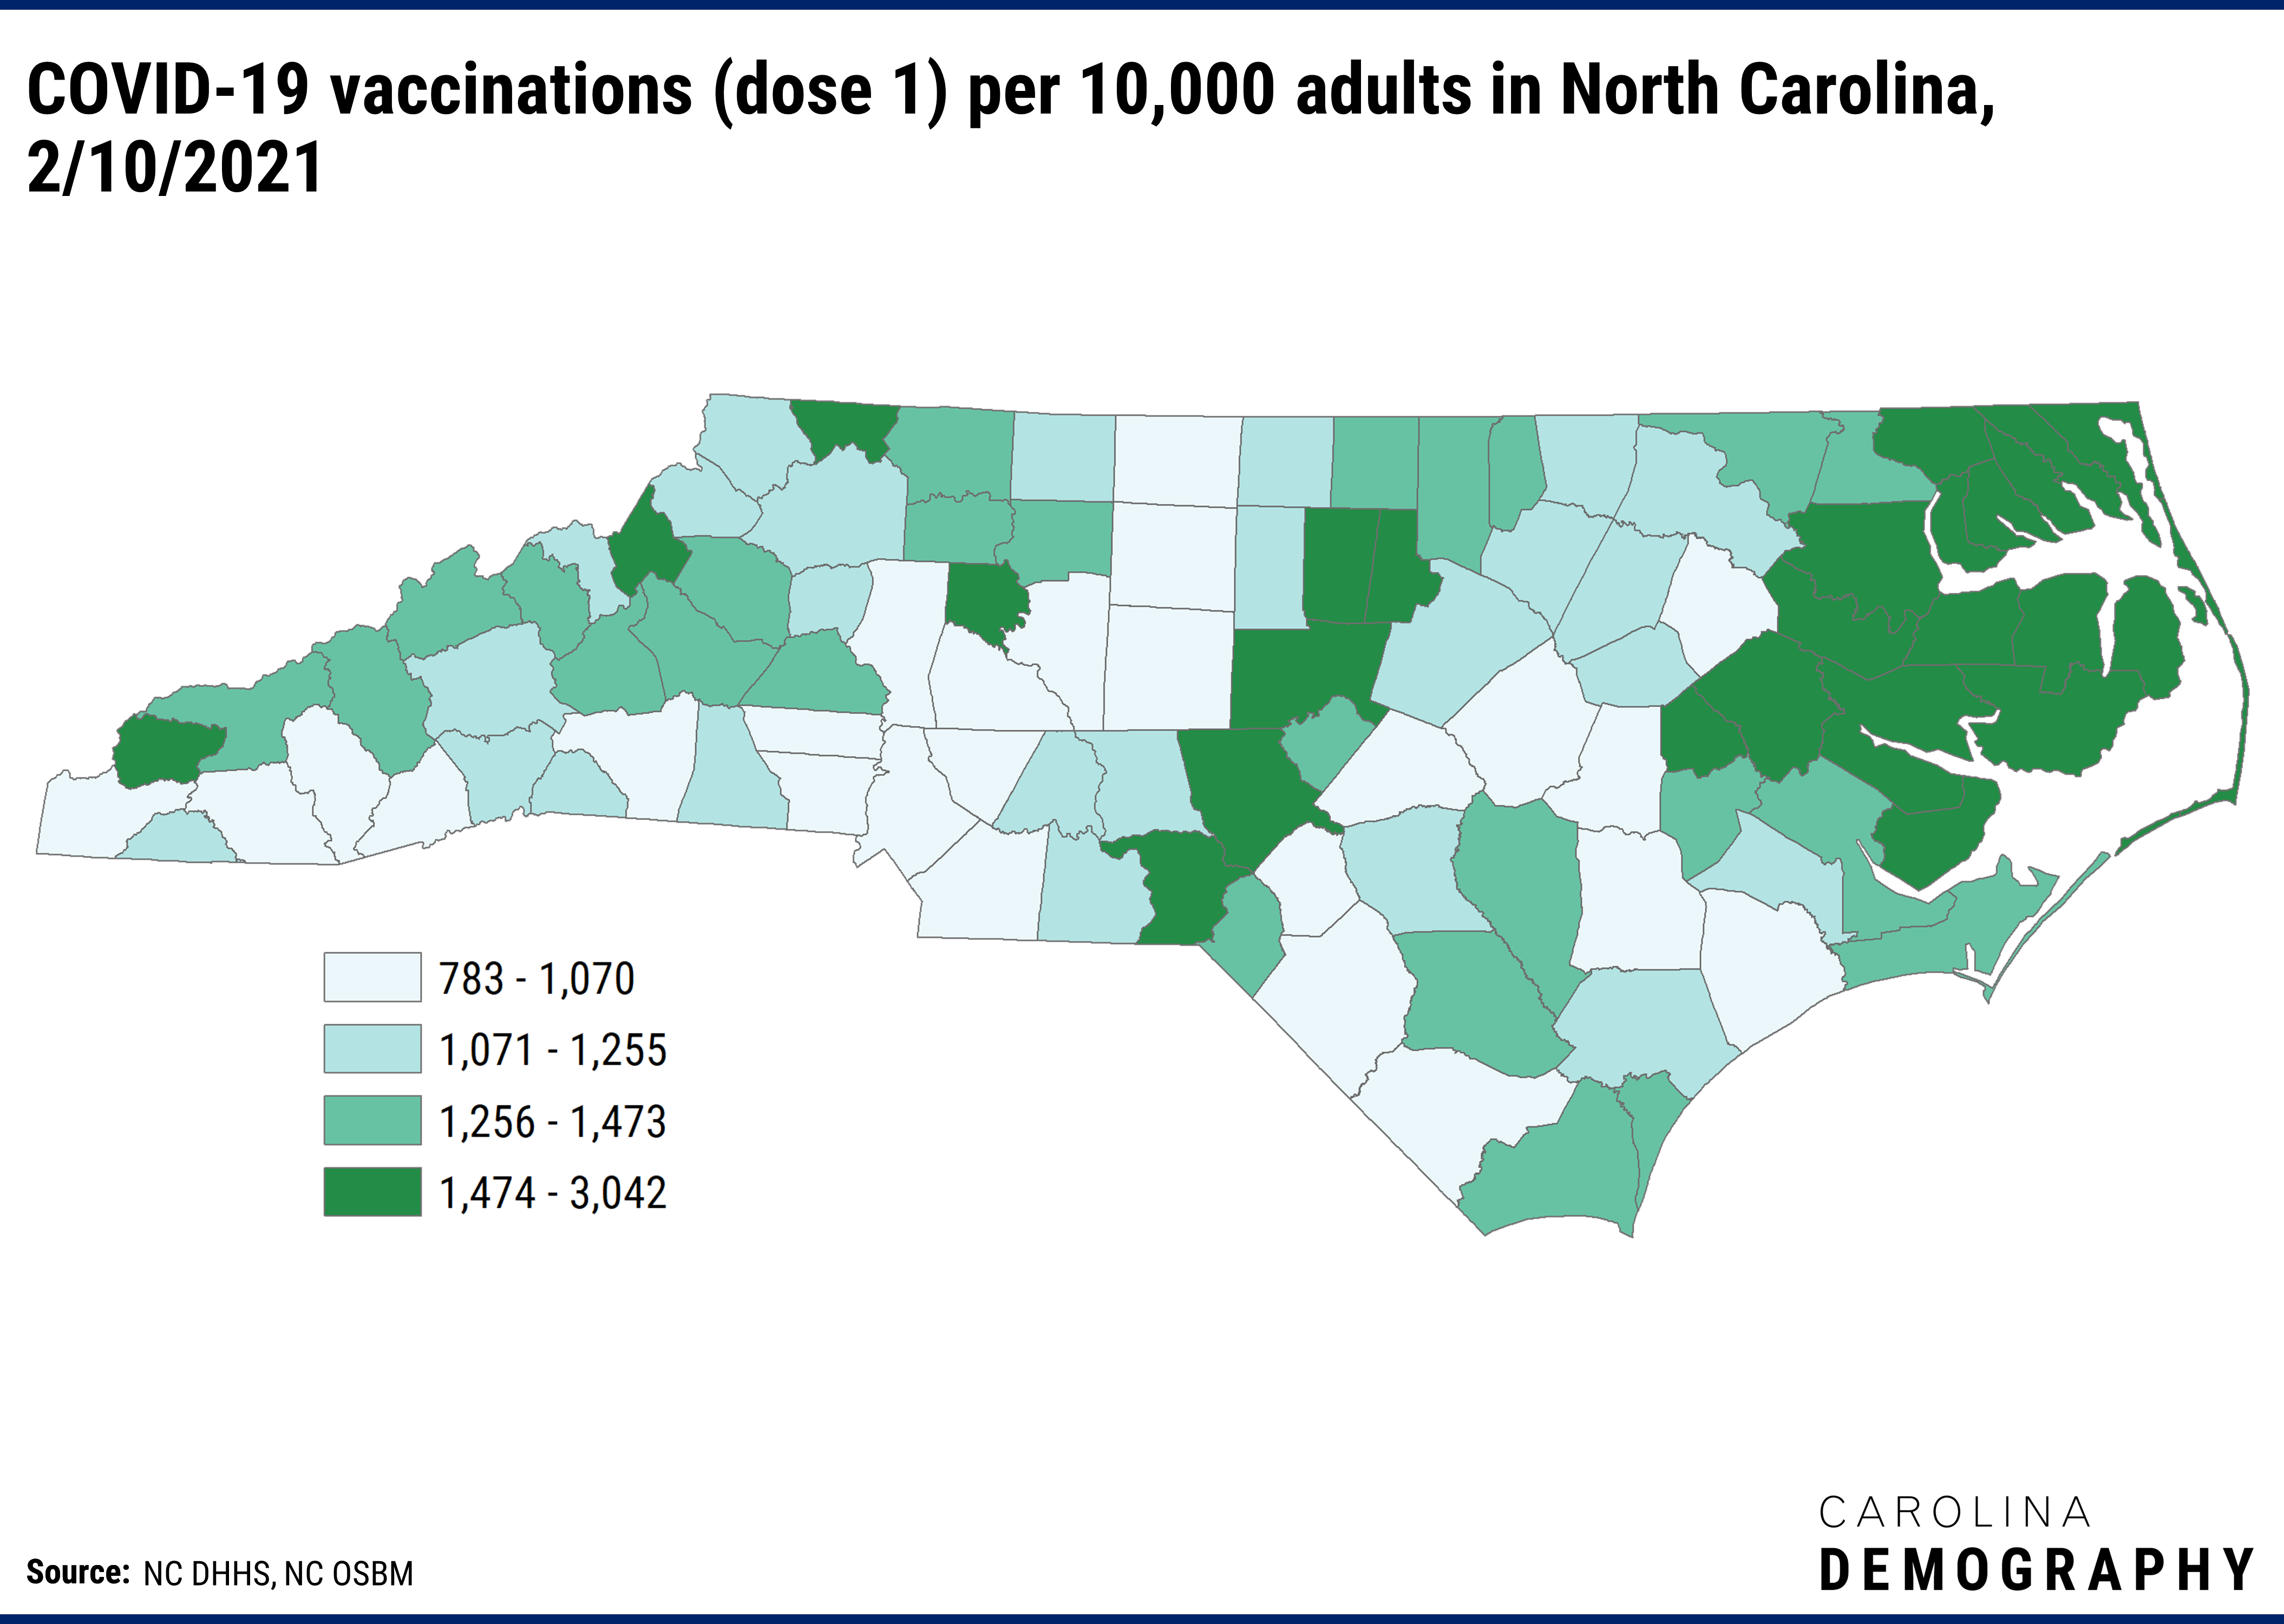
Counties with the lowest vaccination rates per 10,000 adults are Onslow (783), Jackson (823), Hoke (837), Randolph (837), and Wayne (840).
Note: County totals may not sum to state totals if cases, deaths, or vaccination data were missing county location.
Need help understanding population change and its impacts on your community or business? Carolina Demography offers demographic research tailored to your needs.
Contact us today for a free initial consultation.
Contact UsCategories: Health & Environment, NC in Focus

The Center for Women’s Health Research (CWHR) at the University of North Carolina School of Medicine released the 12th edition of our North Carolina Women’s Health Report Card on May 9, 2022. This document is a progress report on the…

Dr. Krista Perreira is a health economist who studies disparities in health, education, and economic well-being. In collaboration with the Urban Institute, she recently co-led a study funded by the Kate B. Reynolds Foundation to study barriers to access to…

Our material helped the NC Local News Lab Fund better understand and then prioritize their funding to better serve existing and future grant recipients in North Carolina. The North Carolina Local News Lab Fund was established in 2017 to strengthen…
Your support is critical to our mission of measuring, understanding, and predicting population change and its impact. Donate to Carolina Demography today.