The majority of North Carolina’s growth over the past few decades has been from net migration, meaning more people moved here than moved away. We last looked at migration to North Carolina in June 2021, and wanted to see how things have changed over the past year.
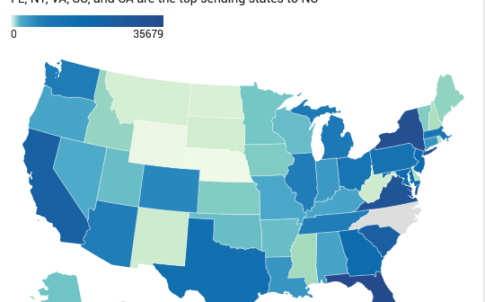
Nearly 366,000 individuals moved to North Carolina in 2021, according to the U.S. Census Bureau’s American Community Survey (ACS). Most of those individuals – 324,500 or 89% of all in-migrants – moved to North Carolina from another state. (Note: this also includes 960 in-migrants from Puerto Rico.) Top states were:
According to the estimates, no one moved to North Carolina from Nebraska in 2021 (We should say: it is likely that someone moved, but because the number is quite small across the state, they were not captured in the American Community Survey’s sample).
The remaining 41,500 or 11% of in-migrants to North Carolina in 2019 moved here from another country. Relative to years past, foreign immigration has taken a slight downturn. This trend is likely due to residual limits on foreign migration in response to the COVID-19 pandemic. Top countries for 2021 were:
Many of the individuals moving here from other states and countries are NC-born individuals moving back to the state. About one in every six migrants to North Carolina in 2021—60,900 individuals—was born in North Carolina.
Among the top-sending states, in-migrants from neighboring South Carolina were the most likely to be NC-born (24%) while in-migrants from New York (6%) were the least likely to be NC-born. Among the top-sending countries in 2019, in-migrants from Mexico (25%) and South Korea (24%) were the most likely to be NC-born. In-migrants from Honduras (4%) and India (3%) were the least likely to be NC-born.
Source: American Community Survey, IPUMS-USA
Need help understanding population change and its impacts on your community or business? Carolina Demography offers demographic research tailored to your needs.
Contact us today for a free initial consultation.
Contact UsCategories: Carolina Demographics, NC in Focus

The Center for Women’s Health Research (CWHR) at the University of North Carolina School of Medicine released the 12th edition of our North Carolina Women’s Health Report Card on May 9, 2022. This document is a progress report on the…

Dr. Krista Perreira is a health economist who studies disparities in health, education, and economic well-being. In collaboration with the Urban Institute, she recently co-led a study funded by the Kate B. Reynolds Foundation to study barriers to access to…

Our material helped the NC Local News Lab Fund better understand and then prioritize their funding to better serve existing and future grant recipients in North Carolina. The North Carolina Local News Lab Fund was established in 2017 to strengthen…
Your support is critical to our mission of measuring, understanding, and predicting population change and its impact. Donate to Carolina Demography today.