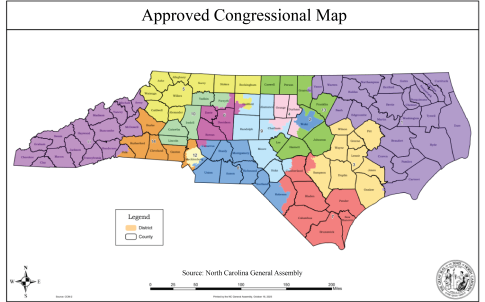
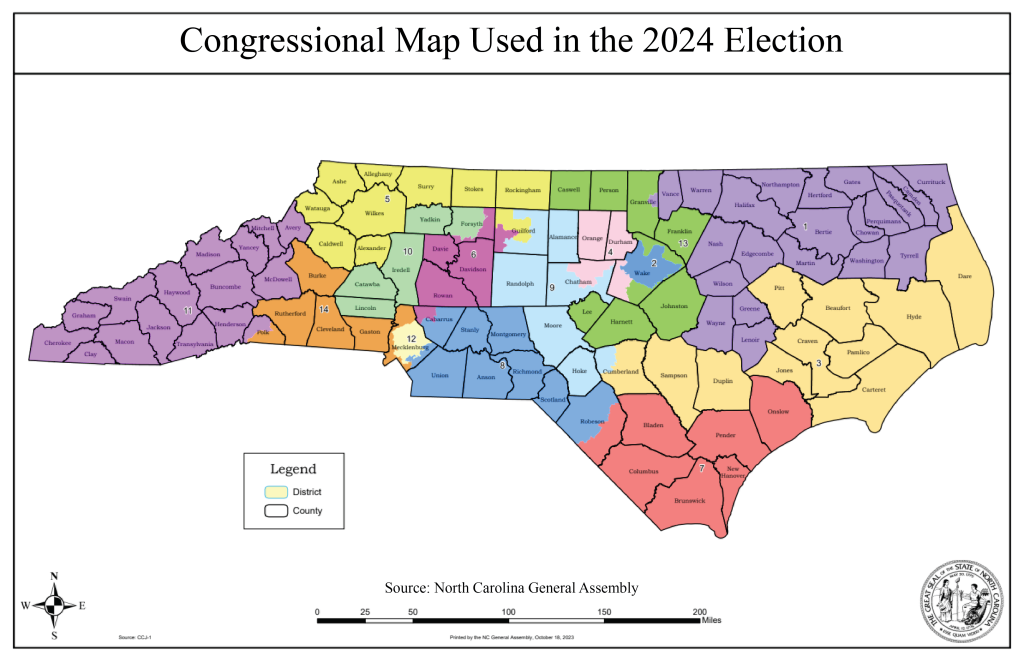
On Wednesday, October 22nd, North Carolina lawmakers approved new congressional maps for the state, which change the makeup of Congressional Districts 1 and 3 in Eastern NC. The new maps are abnormal because redistricting typically only happens once every ten years, following the Decennial Census. This is the first time in the modern era that North Carolina has redrawn maps mid-decade without being court-ordered to do so. Although the NC Republican leadership maintains that no demographic data on race and ethnicity were used to make the new maps, historically, demographic data from the U.S. Census Bureau serve as the foundation of congressional redistricting, and demographic factors such as race and ethnicity and age are used to ensure compliance with the Voting Rights Act. In this post, we’ll walk through how the demographic composition of Congressional Districts 1 and 3 has changed between the old and new maps.
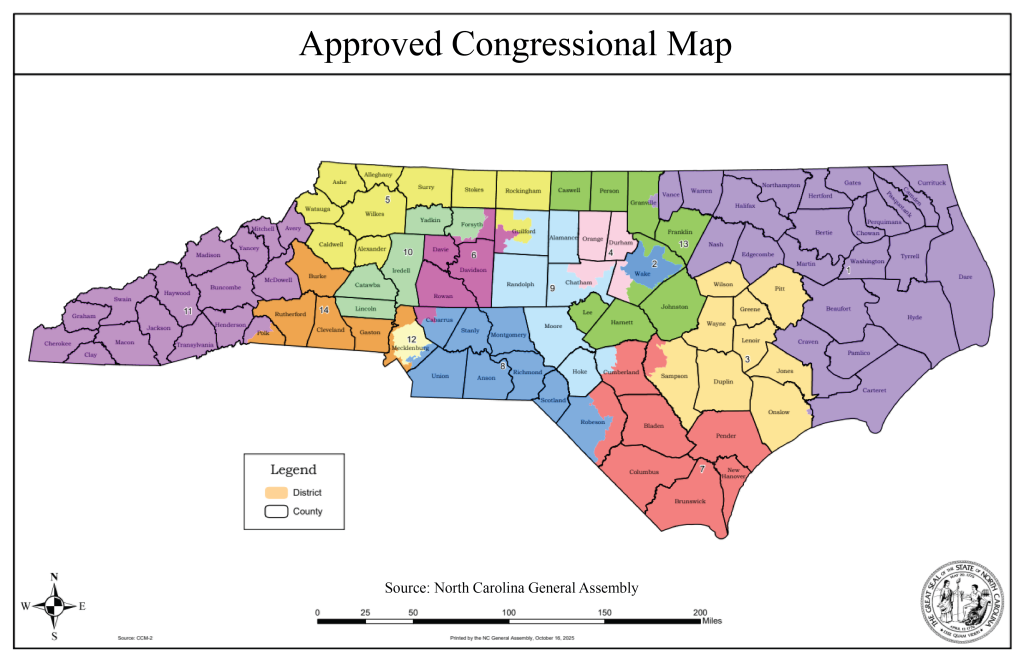
The new map substantially alters the 1st Congressional District in northeastern North Carolina, a region of the state historically known as the Black Belt because of the relatively larger share of Black residents. With the approval of the new map, Beaufort, Carteret, Craven, Dare, Hyde, and Pamlico Counties, and a section of Onslow County, have been moved from District 3 to District 1. Greene, Lenoir, Wilson, and Wayne Counties have been moved from District 1 to District 3.
Before the change, North Carolina’s 1st congressional district had the highest percentage of Black voters in the state. The Black Citizen Voting Age Population (CVAP) of District 1 was 40.7%, and 52.3% was white. With the new map, the share of eligible voters who are Black has dropped to 32.1% and the share of eligible voters who are white has increased to 61.4%. For District 3, the share of eligible voters who are Black will increase from 20.3% to 28.7% and the share who are white will decrease from 68.6% to 59.6%.
Of the citizen voting age population reallocated from District 1 to District 3, 36.8% are Black and 54.3% are white. Conversely, 78.7% of voters moving into District 1 from District 3 are white, and 13.9% are Black.
The lion’s share of new District 1 voters is older and white.
Among the voting age population being reallocated to District 1, more than 4 out of 5 residents who are 45 and older are white. This population is roughly 20% higher across these age groups than the population being reallocated to District 3.
North Carolina’s new congressional map has resulted in substantial shifts in the demographic composition of the 1st and 3rd Congressional Districts. Our focus here has just been on the demographic shifts, but if you want to read more about the implications of the new map for partisan affiliation, please check out the work of our friends and colleagues, Dr. Chris Cooper at Western Carolina University and Dr. Michael Bitzer at Catawba College. Finally, our update to our annual series on the demographics of registered voters will be hitting your inbox soon!
Need help understanding population change and its impacts on your community or business? Carolina Demography offers demographic research tailored to your needs.
Contact us today for a free initial consultation.
Contact UsCategories: Elections & Voting

The Center for Women’s Health Research (CWHR) at the University of North Carolina School of Medicine released the 12th edition of our North Carolina Women’s Health Report Card on May 9, 2022. This document is a progress report on the…

Dr. Krista Perreira is a health economist who studies disparities in health, education, and economic well-being. In collaboration with the Urban Institute, she recently co-led a study funded by the Kate B. Reynolds Foundation to study barriers to access to…

Our material helped the NC Local News Lab Fund better understand and then prioritize their funding to better serve existing and future grant recipients in North Carolina. The North Carolina Local News Lab Fund was established in 2017 to strengthen…
Your support is critical to our mission of measuring, understanding, and predicting population change and its impact. Donate to Carolina Demography today.


