Welcome to our blog
Keep up with our latest demographic insights

Nationally, and in North Carolina, there was evidence of a Covid-19 “baby bust”, meaning the number of births decreased after the pandemic started in March 2020. We reached out to the State Center for Health Statistics (SCHS) for updated data. What does this new data tell us? We did see a decrease but it was smaller than expected First, the Covid-19 baby bust was real, but not as large as we initially reported. Last year,…

Today we are launching a new tool with myFutureNC—the myFutureNC Attainment Trends Workbook—to help you understand trends in educational indicators at the state- and county-level. This tool draws from state and federal sources to highlight trends in three attainment-relevant areas: Academic Readiness, including NC Pre-K participation, College- and Career-Ready in Math and Reading, Advanced Placement and College & Career Promise participation, chronic absenteeism, and high school graduation; College & Career Access, including ACT performance, FAFSA…
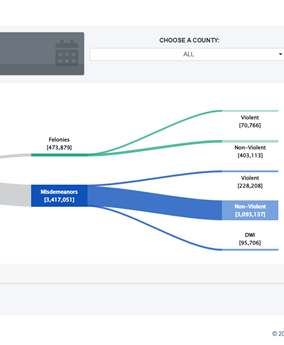
The Criminal Justice Innovation Lab (“Lab”) at UNC’s School of Government recently released a Measuring Justice Dashboard. The dashboard visualizes millions of North Carolina criminal justice records to help stakeholders understand state and local systems, see where they are doing well, and spot areas that may need attention. We spoke with Jessica Smith, Lab Director and W.R. Kenan Jr. Distinguished Professor of Public Law and Government, about the dashboard and how it was built. Why…
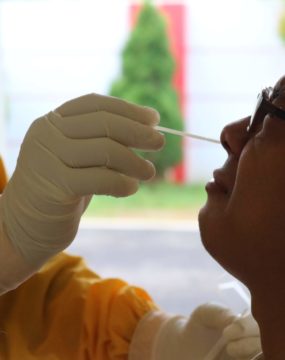
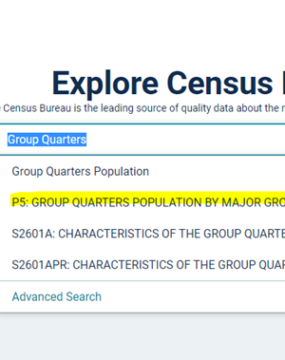
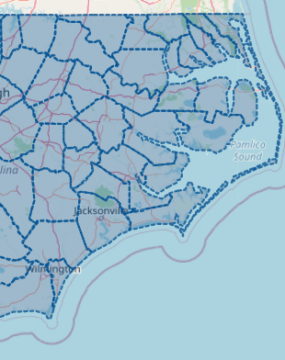
The federal government launched a new website on Wednesday to provide four free at-home COVID-19 tests for every residential address in the United States. There are many households in the United States with more than four residents living in them. Who are these households and where are they located? We also wanted to learn more about households that may need alternative ways of accessing the material – because they don’t have Internet – or that…

This story has been republished from Kaiser Health News. We have added North Carolina-specific information about vaccination rates in each county.You can read the original story here. Jessica Choi provided data specific to North Carolina for this post. KHN reporting by Rachana Pradhan and Hannah Recht January 14, 2022 Two months after Pfizer’s covid vaccine was authorized for children ages 5 to 11, just 27% have received at least one shot, according to Jan. 12…
The 2020 census is a point-in-time count of all individuals living in the United States on April 1, 2020. As part of ensuring complete and accurate data, the Census Bureau gives communities the opportunity to request a review of their census count. This process, known as the Census Count Question Resolution (CQR) program, began on January 3, 2022. CQR is limited in its scope. Notably, it does not address potential omissions in the 2020 Census.…

Dr. Michael Cline is the state demographer for North Carolina at the Office of State Budget and Management and has given us permission to re-post his content here. Each year, he publishes population estimates and projections for North Carolina and its counties. North Carolina’s population growth continues, despite the challenges brought on by the COVID-19 pandemic. The state gained more people than all but Texas, Florida, and Arizona. Between the April 1, 2020 Census…

As an applied demography group located within a research university, we are always looking for ways to share what we learn with the public and highlight work that takes place within our domain. Today, we're kicking off a series of interviews with interesting people from all across North Carolina who frequently use demographic data in their work. If you'd like to nominate someone (or yourself) for this series, please reach out to demography@unc.edu - this…

Ed note: Though we cover a range of demographic topics, we hold a special spot in our hearts for our annual report on NC's state vegetable, the humble sweet potato. Previous coverage:2020, 2019, 2018, 2017, 2015, 2014. Happy Thanksgiving! The year of 2020 has been an especially challenging year for the fresh vegetable industry due to the the historic wildfires over the West Coast; the August storms in the Northern Midwest, and Hurricane Laura’s affect…
Today we are launching a new tool with myFutureNC to help you visualize educational indicators at the county-level. The County Explorer map tool provides a bird's eye view of county performance and uses data from the 2020 County Profiles. To use the County Explorer tool, select an indicator from the drop-down menu in the left sidebar. Information about the county will be displayed in the right side bar, along with a link to the corresponding…
Your support is critical to our mission of measuring, understanding, and predicting population change and its impact. Donate to Carolina Demography today.