When completing the 2020 Census, respondents are asked to report everyone living in their home on April 1, 2020 – this date is known as “Census Day.”
What do we know about how the nation and North Carolina are responding?
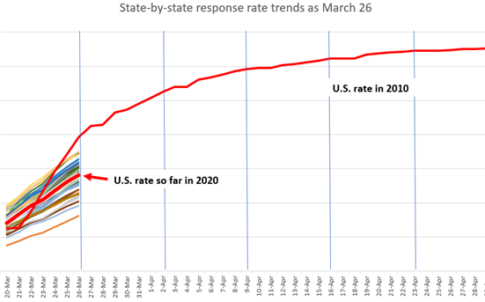
According to City University of New York’s (CUNY) Center for Urban Research, response to the 2020 Census lags rates observed in 2010. As of March 31, 2010, 49% of housing units sent census forms had returned them to the Bureau; on that same day in 2020, that rate was 36.2%.
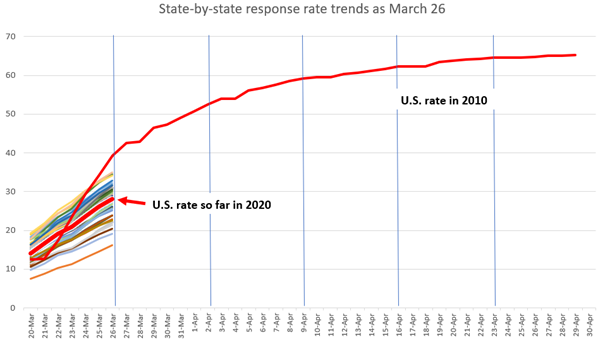
While there are significant differences between 2010 and 2020 that could impact this trend—shifts to online, differences in census mailings, and “no pandemic [that] caused key census operations to be delayed and to completely upend Get Out the Count (GOTC) campaigns”—this metric remains an important one to watch. Household self-response is the most accurate and cost-effective way to collect census data, so lower self-response rates increase risks for undercounts, decrease accuracy, and increase overall cost of conducting the census.
A note on terminology: we are reporting on household “self-response rates” which measure the number of housing units (“households”) that have completed a census form divided by the total number of housing units to which the Census Bureau mailed an invitation to complete the census. In the years preceding the decennial census, the Bureau does an extensive address canvassing operation to ensure that its Master Address File (MAF) has a complete accounting of all housing unit addresses in the United States. Other census operations, such as counting people in group quarters facilities, such as dormitories, prisons, and nursing homes, and counting homeless populations or people in transient locations, such as campgrounds, are not captured in this rate.
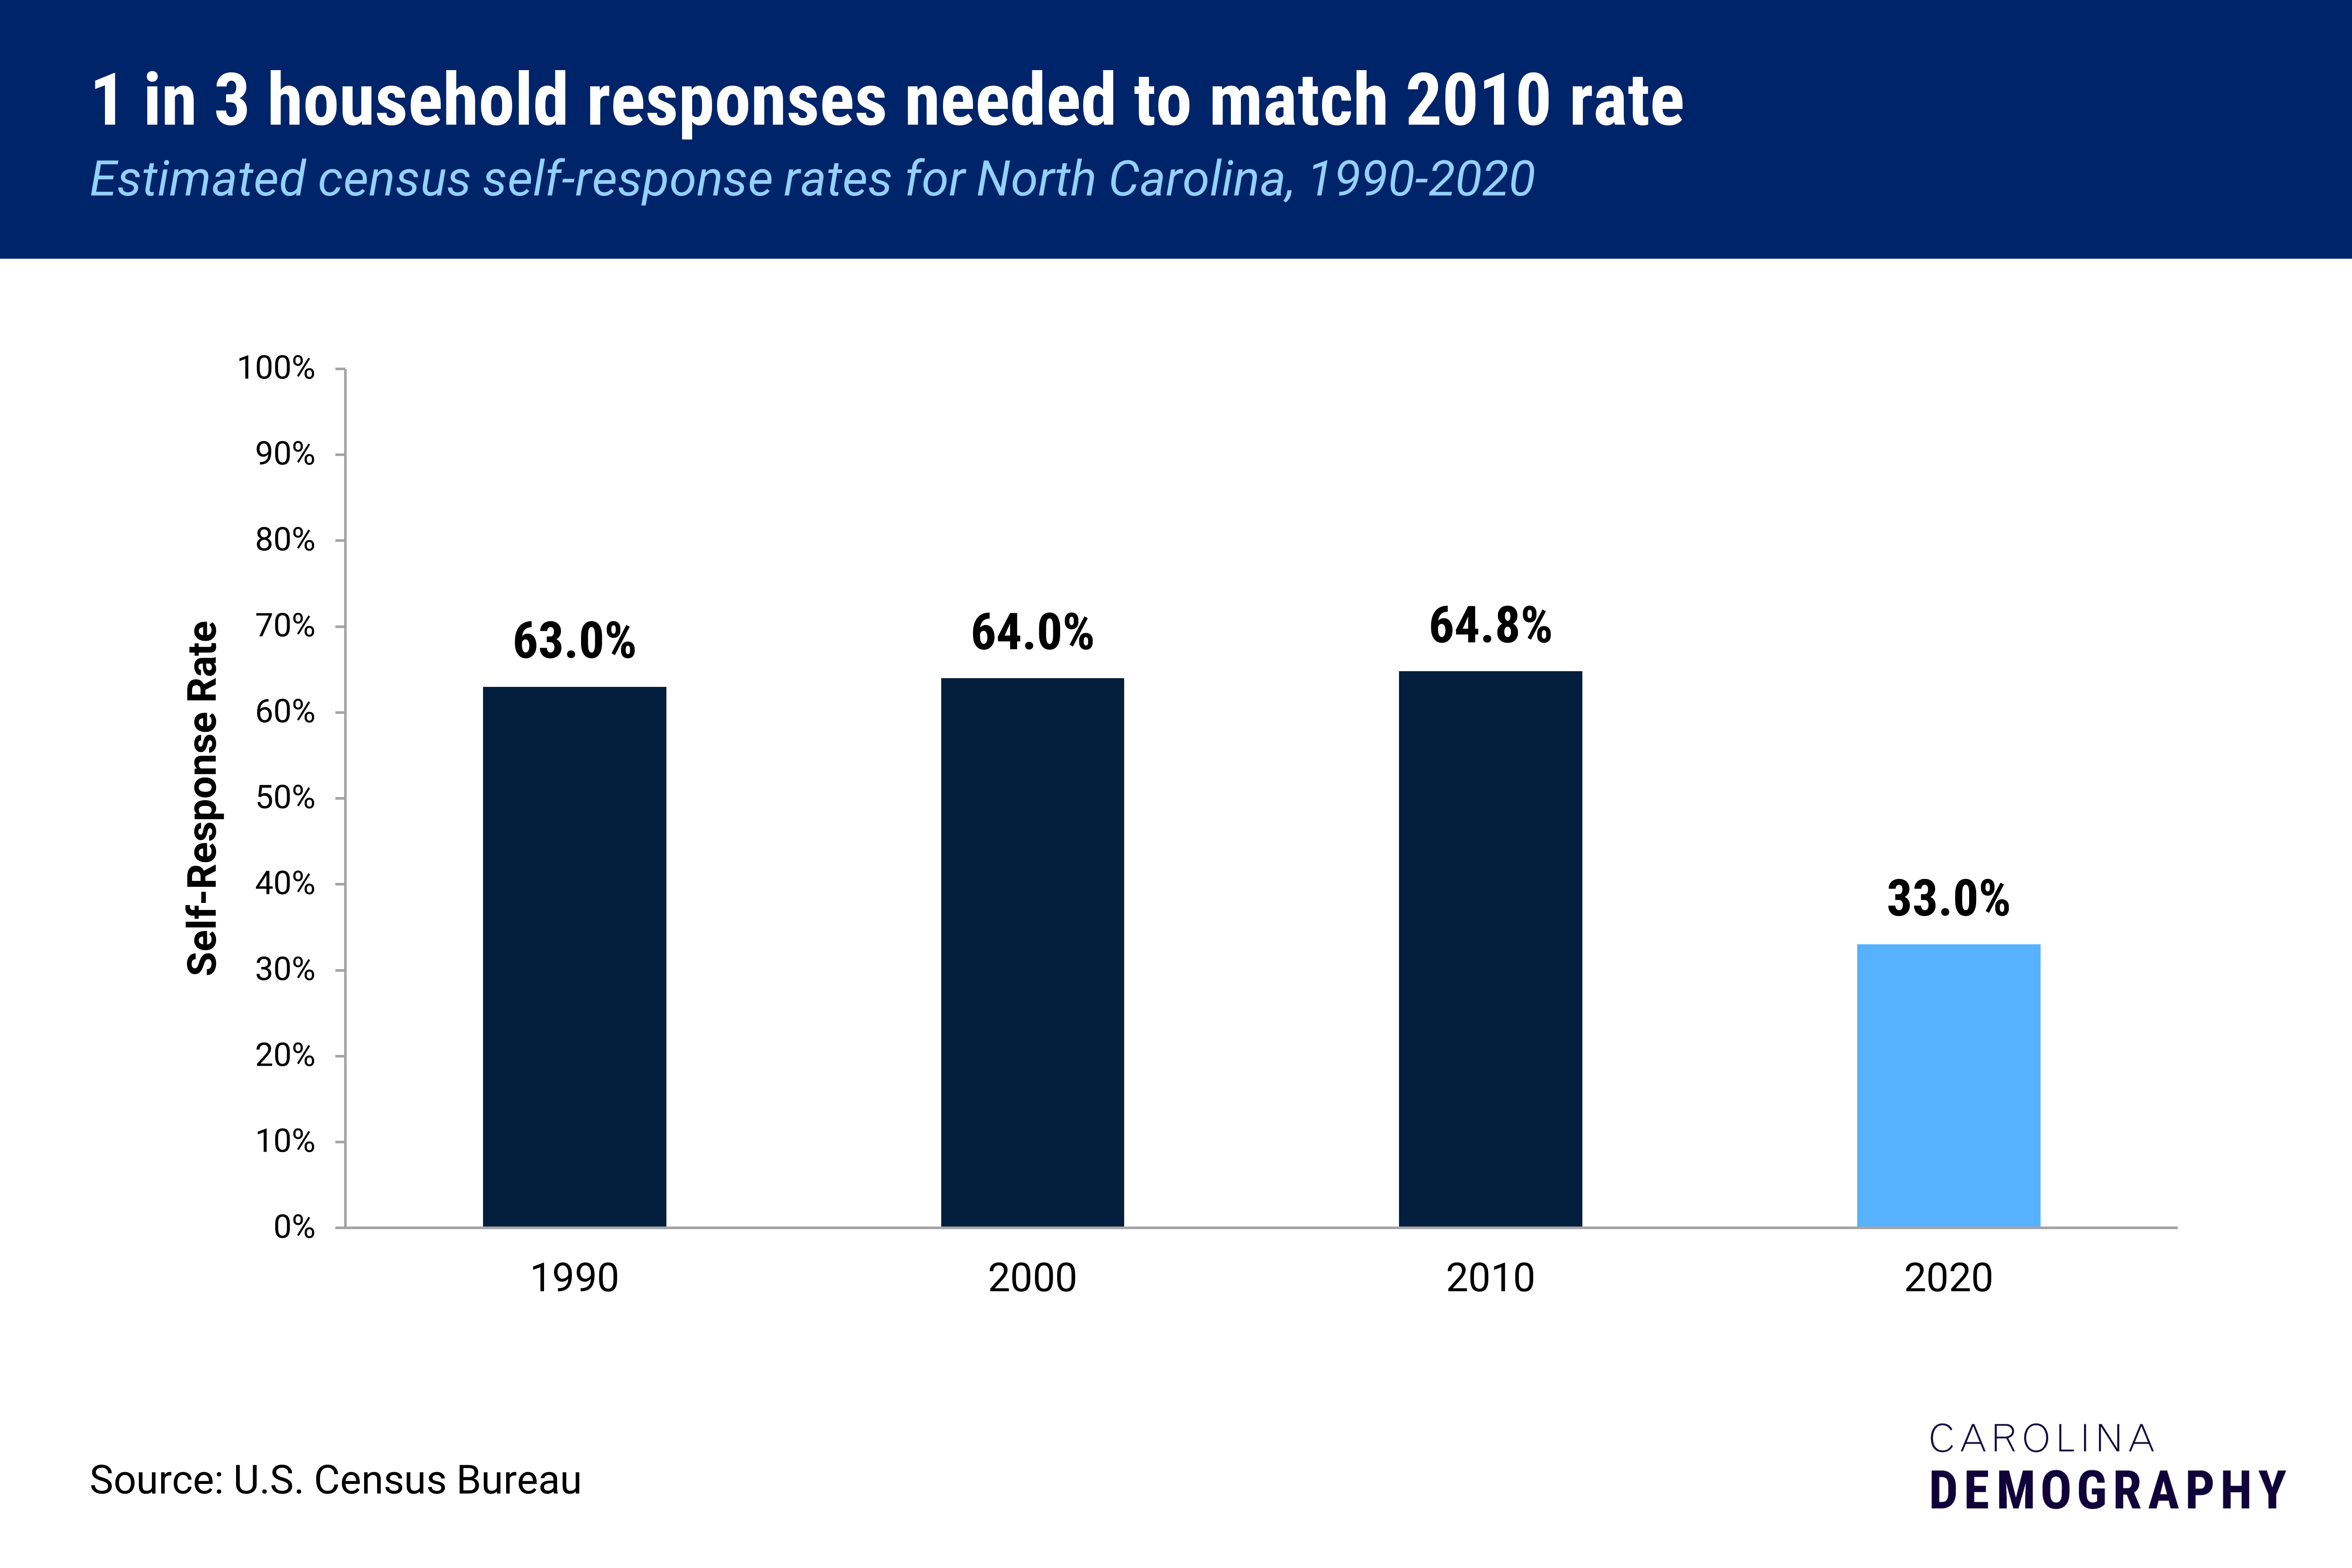
One in three NC households completed their census as of March 31, 2020, below the national average of 36.2%. North Carolina is ranked 39th out of the 50 states and DC.
In every decade since 1990, North Carolina has improved its self-response rates: 63% of NC households self-responded in 1990. This increased by a percentage point to 64% in 2000 and increased to 64.8% in 2010. Another 31.8% of NC households need to respond to match the 2010 rates.
The 2020 Census marks the first census where all households have the option to respond to the census online (https://my2020census.gov). As of March 31:
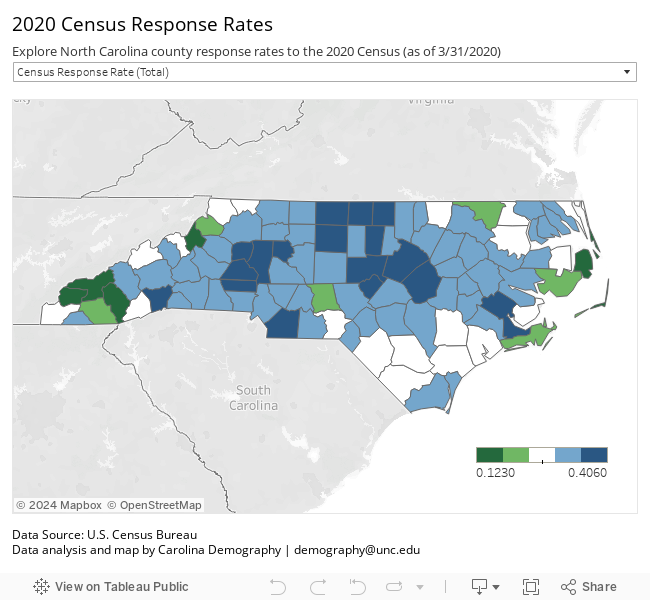
Apart from coastal Dare county, the lowest-responding NC counties are located in the western region of the state: Graham (12.3%), Avery (12.5%), Dare (14.1%), Jackson (14.7%), and Swain (16.2%). Each of these counties has a high share of housing dedicated to seasonal or recreational use. Statewide, 4.6% of housing units were vacant for seasonal use according to the 2018 American Community Survey; among these lowest-responding counties, this proportion ranges from 28% in Jackson to 41% in Avery.
Seasonal housing can impact the self-response rate because we are measuring the percentage of housing units for which a census form has been completed. If no one is currently living at that unit, this can lower the response rate.
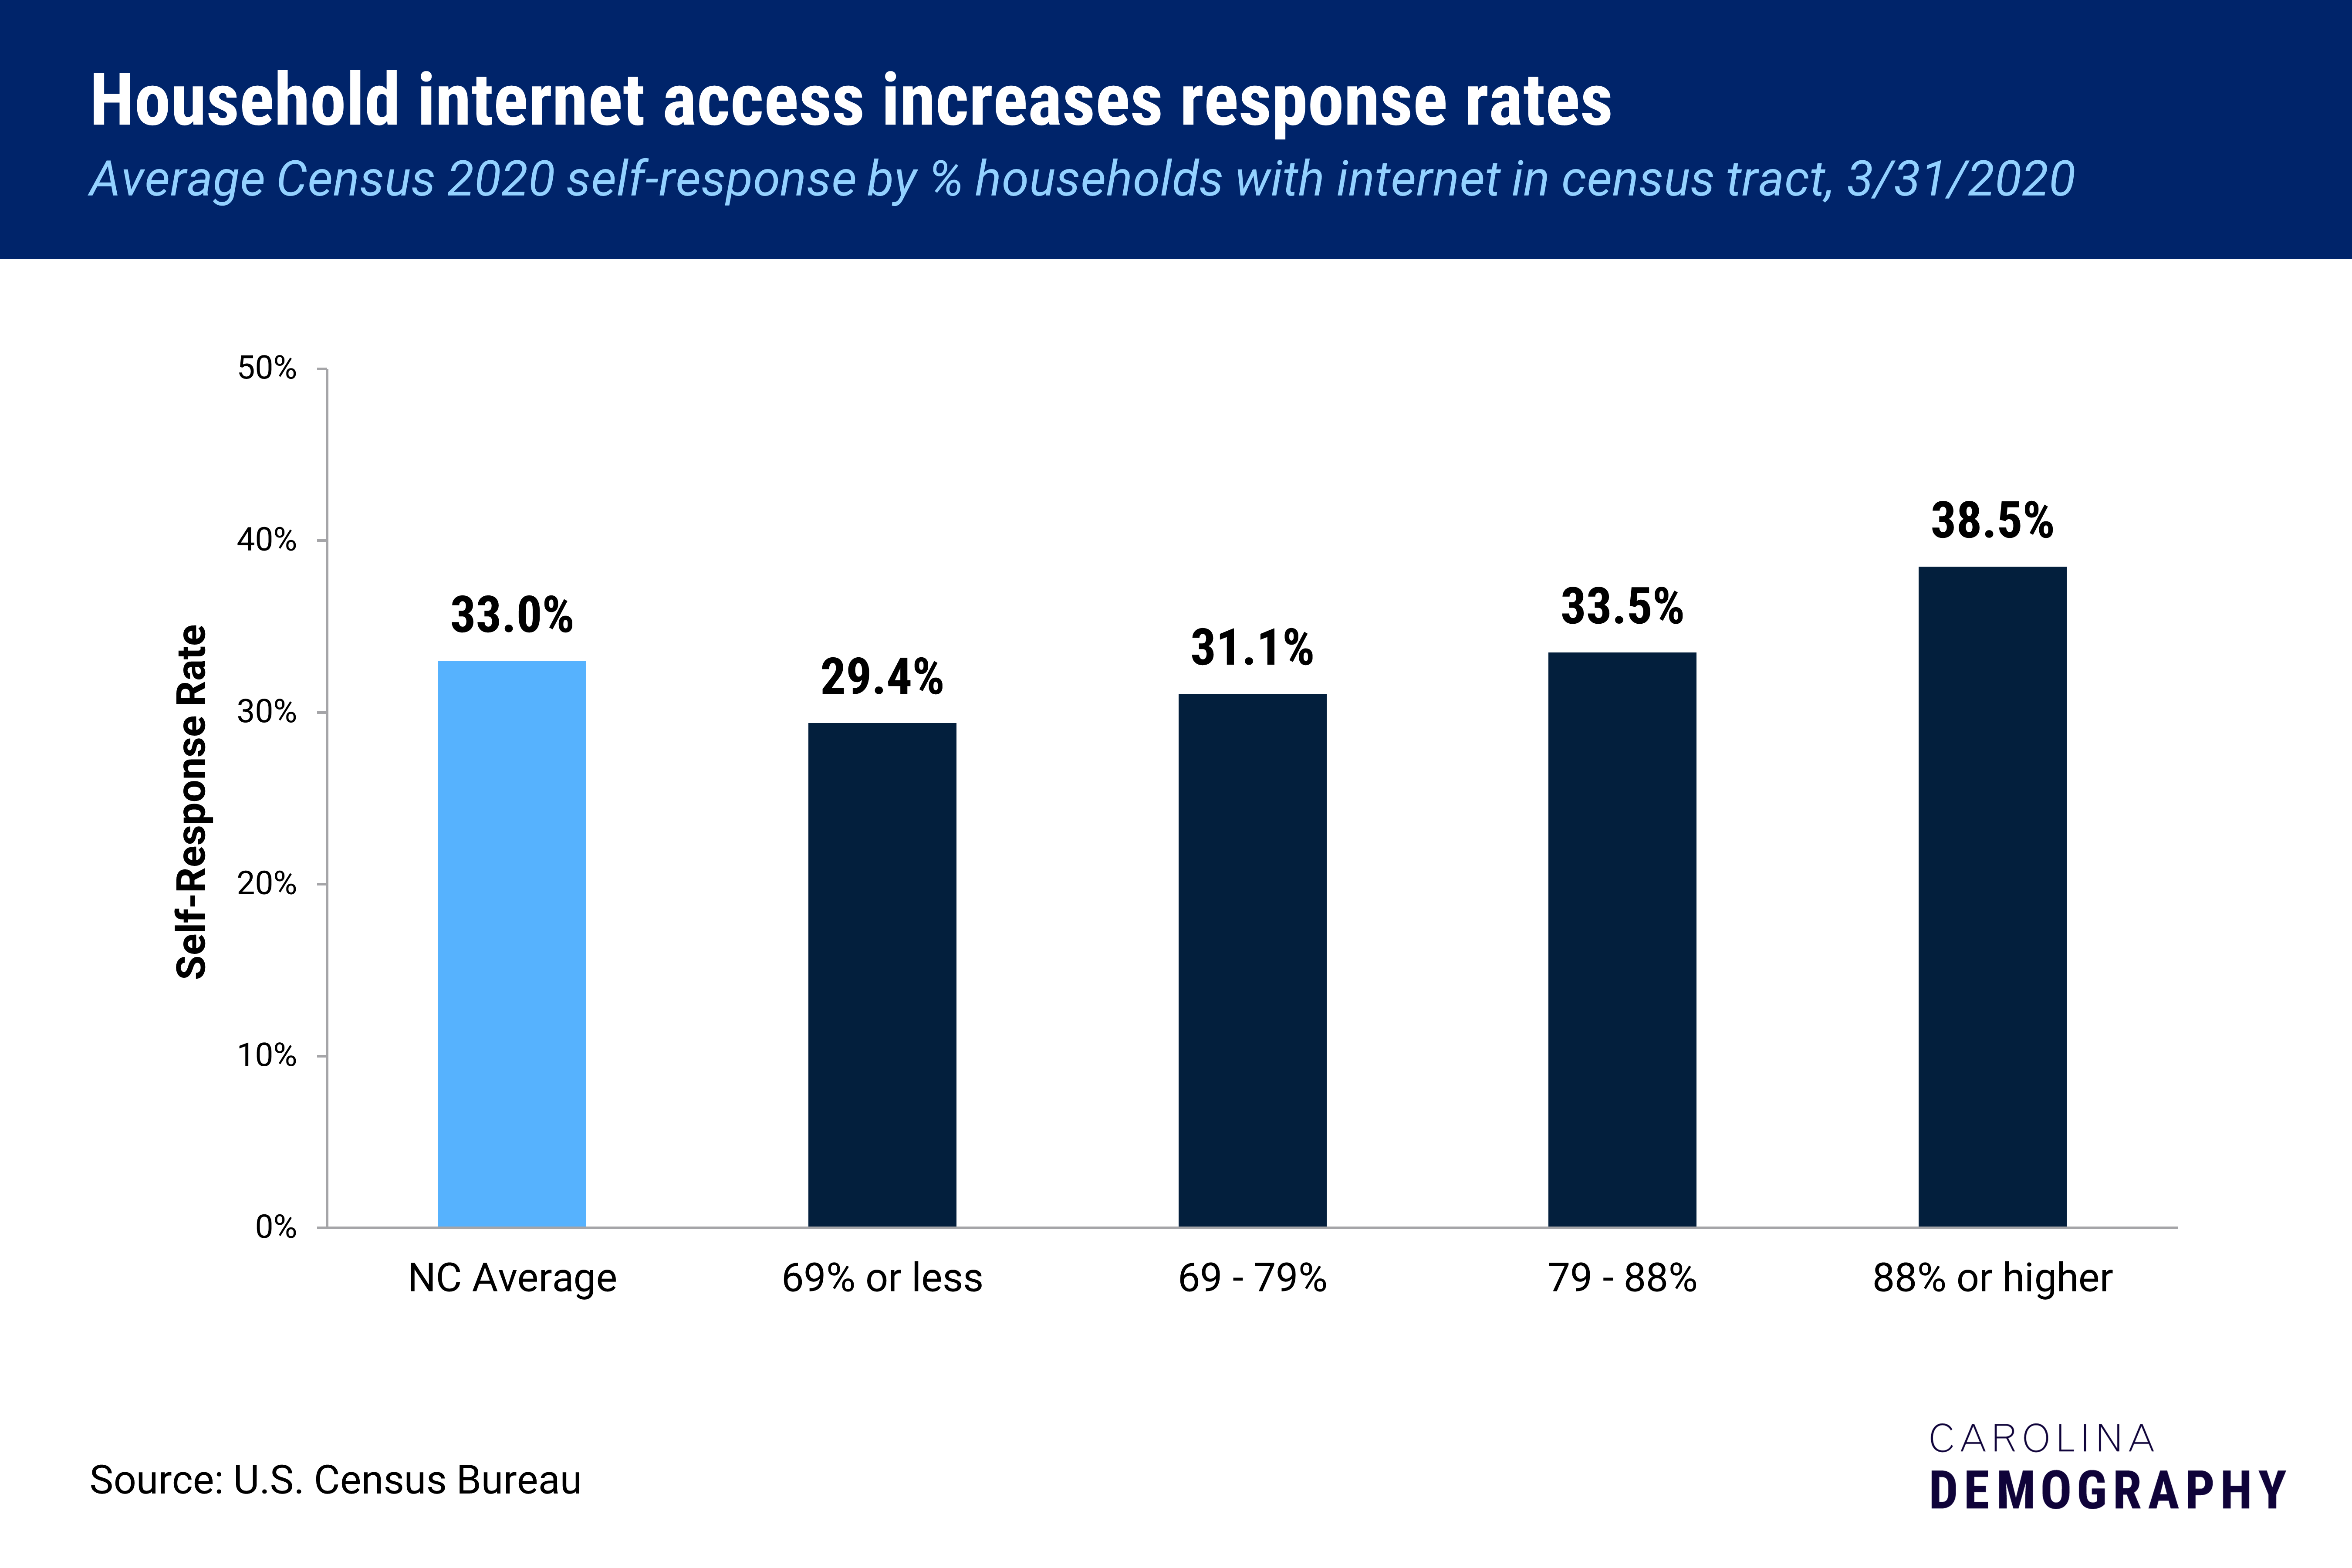
High rates of internet access are associated with higher average response rates. Across North Carolina, the average response rate was lowest in census tracts with the lowest internet access (29.4%) and highest in tracts where most households had internet (38.5%). The highest responding counties are concentrated in the Triangle, Charlotte, and the Triad: Orange (40.6%), Wake (39.5%), Union (39.4%), Chatham (38.5%), and Guilford (36.9%). In these counties, internet is the dominant response, ranging from just 0.2% of households in Orange to 4.4% of households in Chatham.
Lack of internet access is not necessarily predictive of low response rates, however. Some relatively high-responding counties have very high levels of mail response. In Caswell County, for example, 35.2% of households have responded to the census, above the statewide rate—23.7% responded by mail or phone, more than double the 11.5% who responded online.
Start with our NC Census Tracker which is updated weekly with self-response rates for NC and each county within the state. Other posts:
Need help understanding population change and its impacts on your community or business? Carolina Demography offers demographic research tailored to your needs.
Contact us today for a free initial consultation.
Contact UsCategories: Carolina Demographics, Census 2020

The Center for Women’s Health Research (CWHR) at the University of North Carolina School of Medicine released the 12th edition of our North Carolina Women’s Health Report Card on May 9, 2022. This document is a progress report on the…

Dr. Krista Perreira is a health economist who studies disparities in health, education, and economic well-being. In collaboration with the Urban Institute, she recently co-led a study funded by the Kate B. Reynolds Foundation to study barriers to access to…

Our material helped the NC Local News Lab Fund better understand and then prioritize their funding to better serve existing and future grant recipients in North Carolina. The North Carolina Local News Lab Fund was established in 2017 to strengthen…
Your support is critical to our mission of measuring, understanding, and predicting population change and its impact. Donate to Carolina Demography today.