This blog post is part of a series on how to use the North Carolina Public Schools Statistical Profile. This blog post details how to download different indicators at the district level. We also have tutorials for how to download indicators at the state and school levels.
The North Carolina Public Schools Statistical Profile (NCPSSP) is a great resource for obtaining data on North Carolina’s public school students, personnel and finances. This profile is especially useful if you are looking for enrollment data (available at school, district and state levels) in public and charter schools.
This blog post will detail how to download different indicators from the NC DPI Statistical Profile at the district (LEA) level. For any table, data can be downloaded as a CSV file by clicking “Actions” which is located on the far-right side of the search bar, then selecting “Download”. A CSV will then be downloaded to your computer.
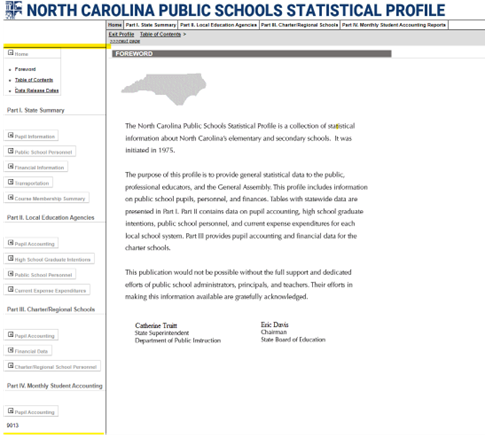
North Carolina Public Schools Statistical Profile website
When you open the North Carolina Public School Statistical website, you’ll see a menu on the right-hand side of the page. The menu is where we want to focus our attention.
The menu is split into four sections:
Part I. State Summary
Part II. Local Education Agencies (LEA)
Part III. Charter/Regional Schools
Part IV. Monthly Student Accounting
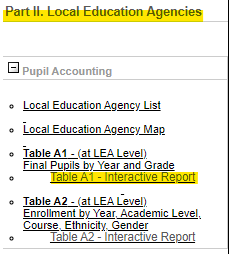
To dial down into the district level, we’ll head to the second section: Local Education Agencies (LEA).
1. Under “Part II. Local Education Agencies” select “Table A1-Interactive Report.”
2. Click “Type” and select “Enrollment” click on “Year” and select 2021, click on “Month” and select “Month Final.”
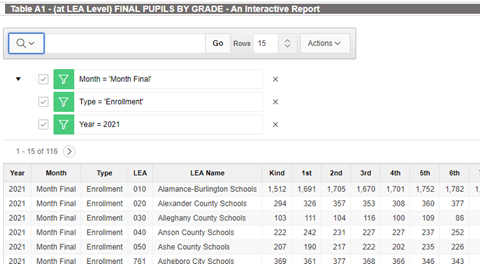
Notice that there is a column titled “LEA” in this table. Each public school district has a unique 3-digit code called an LEA code.
3. To download all district enrollment data click “Actions” and “Download”. Your table will now be downloaded as a CSV onto your computer.
This is the alert text
1. Under “Part II. Local Education Agencies” click on “High School Graduate Intentions”, then click on “Table A4.1-Interactive Report”. If you are looking for a school year prior to 2011, click on “Table A4.1-Interactive Report (Prior to 2011)”.
2. Click on “Year”, or the title of the first column, and select 2021. Your table should look like this. You can always check if you applied the correct filters by looking at the green tabs that appear above the table. The green filter tells me only data from 2021 remains in this table.
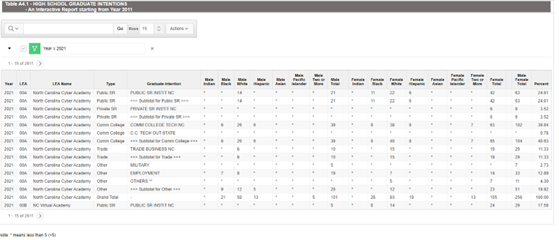
3. Click on “Actions” then “Download”. A CSV will be downloaded onto your computer.
This download includes data regarding post-secondary intentions of high school seniors that graduated in 2021 from all school districts in North Carolina.
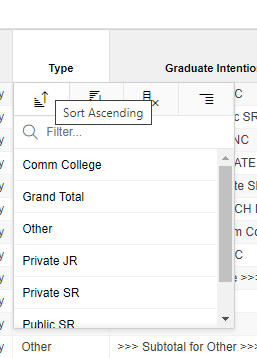
Graduate intentions are broken up into six “Type” categories. These include Community College, Other, Private JR, Private SR, Public SR, and Trade. JR, or Junior, refers to 2-year post-secondary institutions such as community colleges. SR, or Senior, refers to 4-year post-secondary institutions. If you click on the word “Type” in the third column, you will see these options in the drop-down menu.
The Grand Total category, in the third column, is just the sum of all the students across all categories in this column. In the 4th column, each of these categories is broken up into in-state and out of state specifications.
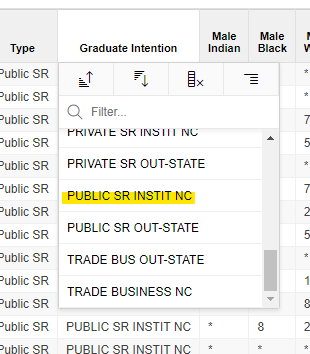
For example, Private SR INSTIT NC (Private Senior Institution In North Carolina) and Private SR OUT-STATE (Private Senior Out of North Carolina) both fall under Private SR.
This is important to keep in mind when looking at the row containing “>>>Subtotal for Private SR>>>” because this row combines two groups of students: one group that went to a Private Senior Institution in North Carolina and one that went to Private Senior Institution outside of North Carolina. If you only want to see, for example, the counts of students who intend to enroll in a public senior institution in North Carolina, you can scroll down to the bottom of the “Graduate Intention” column (4th column) and select “PUBLIC SR INSTIT NC”.
This table gives information on what kind of classes were taken by what kind of students in each district across North Carolina. For example, let’s say I want to know how many students took AP Calculus (AB) in the Orange County School District during the 2012-13 school year.
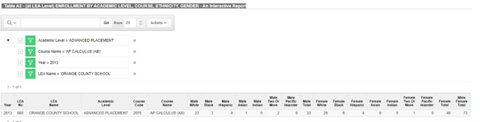
From this table we can see the race/ethnicity and sex breakdowns of those who took AP Calculus (AB) in the Orange County School District during the 2012-13 school year.
If you want to see more rows per page click on the number to the left of the “Actions” tab. You can increase the number of rows to fit more data on the page.
1. Under “Part II. Local Education Agencies” click on the “Public School Personnel” tab.
2. Click on “Table A6-Interactive Report.”
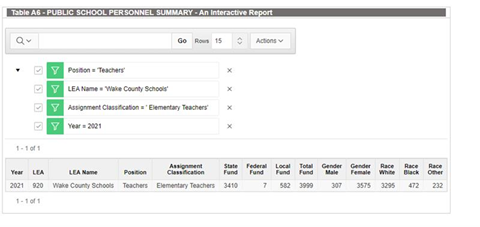
Let’s use Wake County Schools for this example.
3. Click on “LEA Name” and then scroll until you see “Wake County Schools”. Then click on “Year” and select 2021.
4. Click on the word “Position” and select “Teachers.”
5. Click on “Assignment Classification” and select “Elementary Teachers.”
Your table should now look like this. Adding the numbers in the race column together corresponds with number from the “Total Fund” column. Often when adding the numbers in the gender columns together does not add up to the number in the “Total Fund” column. Keep that in mind when working with this table. Adding the male and female column results in 1,020 total elementary teachers, which under counts the total amount of funded teachers.
6. Click on “Actions” and select “Download.”
All data on school teachers/staff will be found in the tab with “Personnel” in the title.
1. Under “Part I. State Summary” click on “Transportation”. Then click on “Table 32-Interactive Report.”
Let’s use Durham County for this example.
2. Click on “LEA Name” and select “Durham County Schools.”
3. Click on “Year” and select 2021. Your table should now look like this.
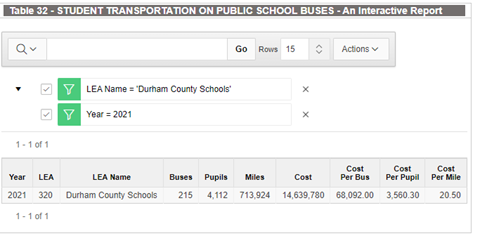
This table shows that during the 2021 school year for Durham County Schools there were 215 school buses in use.
Almost all school level data in the NC DPI Statistical Profile can be found in a table where the title ends with “(at School Level)”. Tables with school level data will also have a column titled “School No” (school number), that always begins with its corresponding three-digit LEA code or district code. For example, Graham High (010348) and Eastern Alamance High (010324) are both in the Alamance-Burlington School District whose LEA code is (010), therefore both school codes start with 010.
Learn more about how to acquire data at the state or school level.
Need help understanding population change and its impacts on your community or business? Carolina Demography offers demographic research tailored to your needs.
Contact us today for a free initial consultation.
Contact UsCategories: Education, NC in Focus, Story Recipe

The Center for Women’s Health Research (CWHR) at the University of North Carolina School of Medicine released the 12th edition of our North Carolina Women’s Health Report Card on May 9, 2022. This document is a progress report on the…

Dr. Krista Perreira is a health economist who studies disparities in health, education, and economic well-being. In collaboration with the Urban Institute, she recently co-led a study funded by the Kate B. Reynolds Foundation to study barriers to access to…

Our material helped the NC Local News Lab Fund better understand and then prioritize their funding to better serve existing and future grant recipients in North Carolina. The North Carolina Local News Lab Fund was established in 2017 to strengthen…
Your support is critical to our mission of measuring, understanding, and predicting population change and its impact. Donate to Carolina Demography today.