How and why populations change is an issue that has implications for planners, policy makers, and the general public. We receive a lot of inquiries from local government officials, community organizations, members of the media, and individual residents about county-level population estimates and how they change over time. In this story recipe we provide the answers to questions that we often receive regarding county-level population estimates and where and how to access and understand data on the components of county population changes.
Every March the U.S. Census Bureau’ Population Estimates Program (PEP) releases the County population estimates for the previous year and a file with the demographic components of population change for every US county. Each release is referred to as the Vintage of the data year the estimates refer to. For example, In March of this year, the PEP released the Vintage 2022 county estimates, which refer to the July 1, 2022 county population estimates. The full schedule of estimated releases is available on the U.S. Census website.
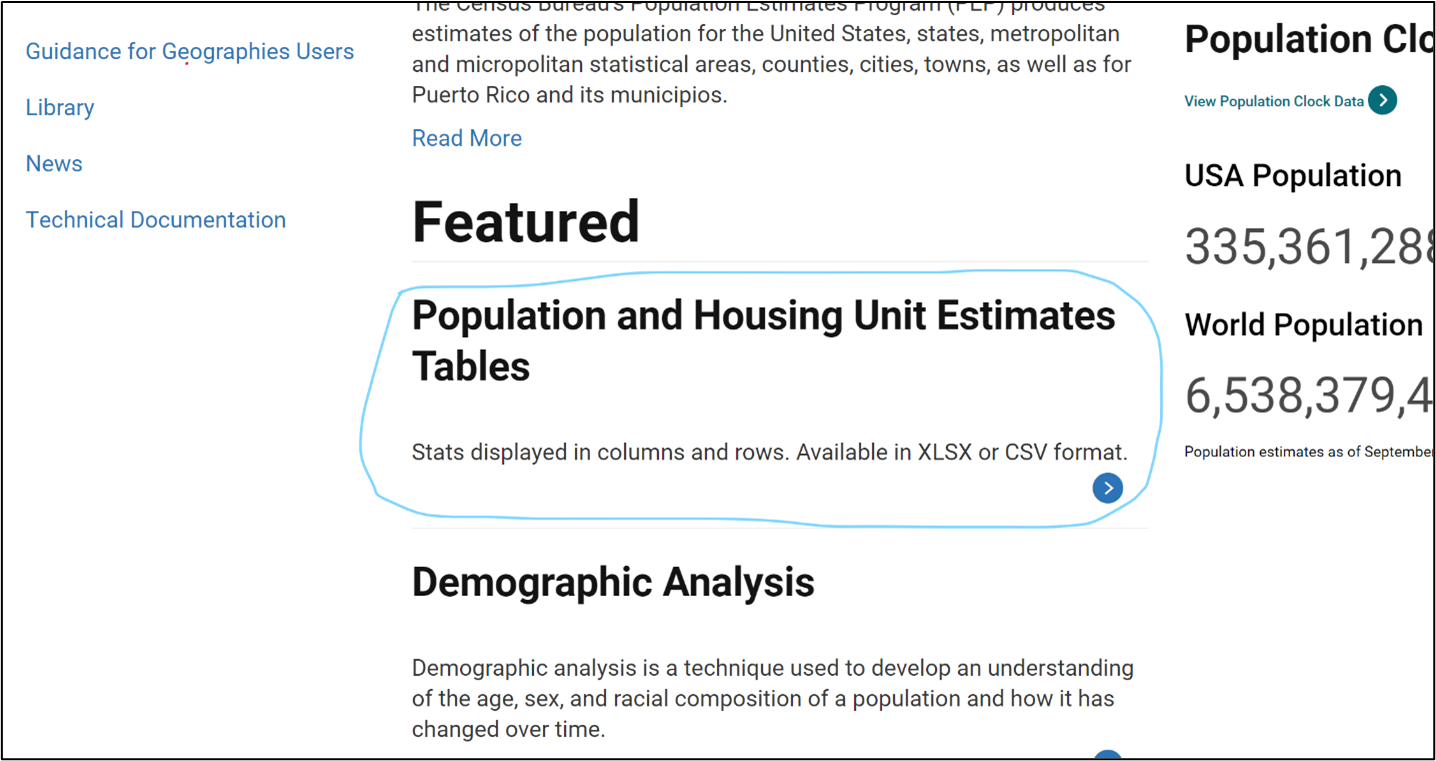
Let’s say I wanted to find the latest population estimates for NC Counties. To do so, I would first navigate to US Census Bureau’s Population and Housing Unit Estimates page. Once at this page, under “Featured” in big bold letters, I want to click on the “Population and Housing Unit Estimates.”
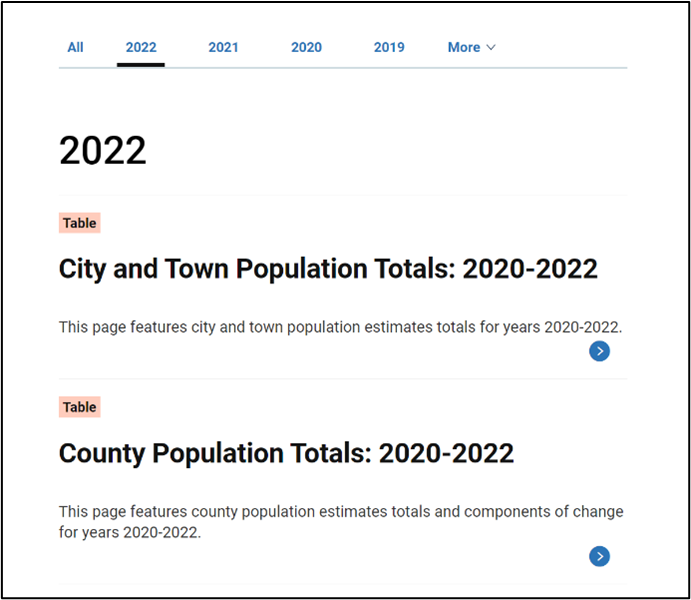
Once I click on the link, I’m taken to another page where we have several options. First, If I scroll down below the explanatory paragraph, I have the option to select the year I want.
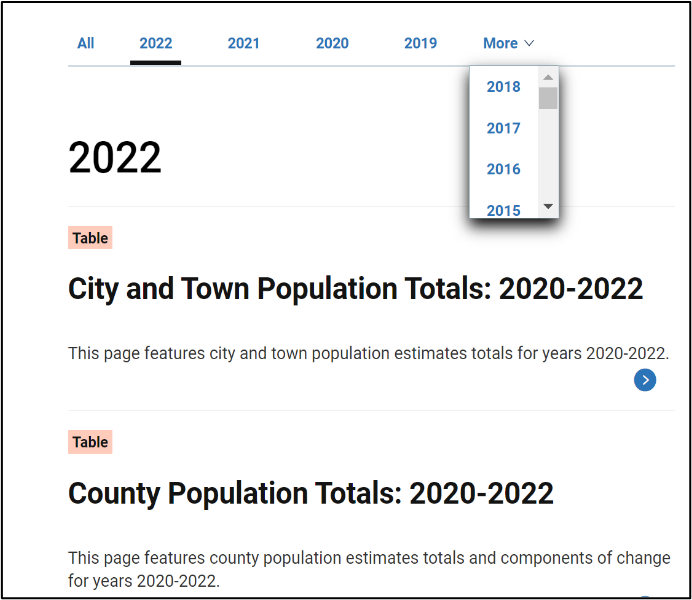
The most current year (2022) is underscored to the left and the years descend through 2019 as I move to the right. If I want previous years’ data, I need to click on “More” tab to the right and scroll down to the year I want.
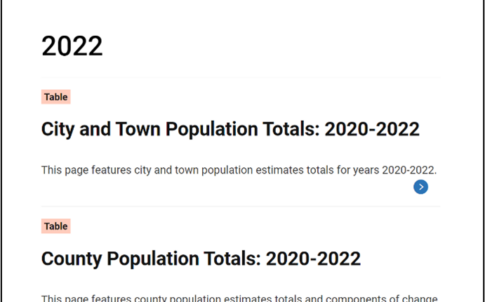
Once I have my year selected, I then have the option to select the geography and the data I want. The options start with City and Town Population Totals: 2020-2022 and proceed to County Population Totals: 2020-2022, then County Population by Characteristics: 2020-2022, which takes me to county population data by age, sex, race, and Hispanic origin, and so on.
For my purposes here, I am interested in the County Population Totals: 2020-2022, so I click on that link, which takes me to the page “County Population Totals and Components of Change: 2020-2022.”
The Census Bureau produces population estimates using what demographers refer to as the “cohort-component method, which is derived from the demographic balancing equation.” You can read more about the cohort-component method and the population balancing equation by clicking on the link to the “Methodology” PDF.
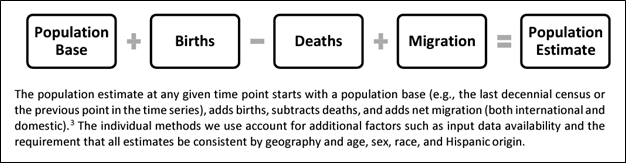
Above, you can see the population balancing equation and the components of change that are included. As you can see, on the far left of this equation is the Population base (either the last decennial census or the previous year in the time series), and to the right are the components of population change, births, deaths, and migration. There are two ways that one can enter a population, by being born into it, or by moving into it. Similarly, there are two ways to exit a population, die or move out. When we think about the components of population change, we typically think about them in terms of “Natural Change” (i.e., Births – Deaths) and Net Migration (i.e., International Migration + Domestic Migration).
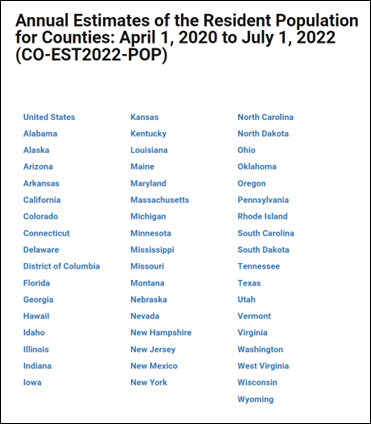
There are several Tables to choose from. The first set of tables is titled “Annual Estimates of the Resident Population for Counties: April 1, 2020 to July 1, 2022 (CO-EST2022-POP). If you click on the blue link for any state, it will automatically download a spreadsheet. If I click on North Carolina, the spreadsheet will be titled “co-est2022-pop-37.” (The 37 refers to North Carolina’s Federal Information Processing System (FIPS) code.
Once you open that spreadsheet, you will see every NC county listed in Column A, the April 1, 2020 population base listed in Column B, and Columns C, D, and E, display the July 1 population estimate for 2020, 2021, and 2022 respectively.
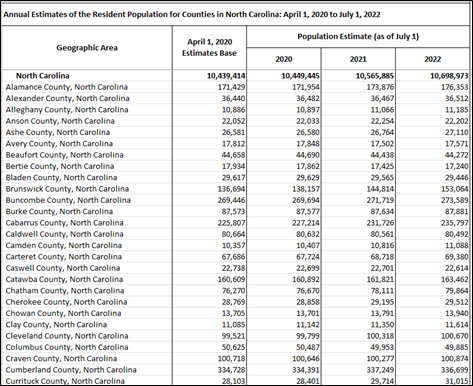
With this table I can see how my county’s overall population has changed since the 2020 Decennial Census through 2022.
If I want to know about the different components of how my county’s population has changed, I need to scroll down the page until I see “Annual and Cumulative Estimates of the Components of Resident Population Change for Counties in the United States: April 1, 2020 to July 1, 2022 (CO-EST2022-COMP)”
Like I did above, when I click on the blue link for North Carolina, it will automatically download an Excel spreadsheet titled, “co-est2022-comp-37.”
This file is different than the one above because it does not give me population totals, rather only displays data on population change and the components of that change. This file can be a little confusing to some, so let’s walk through it.
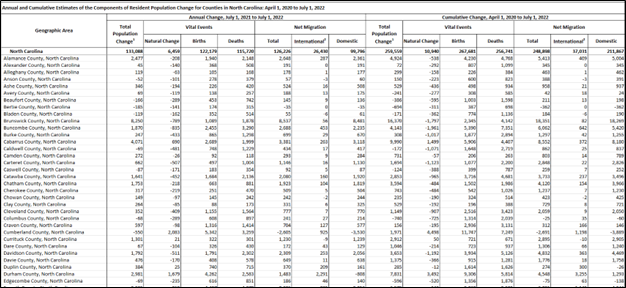
First, it is important to note that there are two overlapping time periods displayed in this table. Columns B-H refer to the population change from July 1, 2021 to July 1, 2022. Column B refers to Total population change, Columns C, D, and E show Natural Change and the births and deaths used to calculate natural change. Column F refers to total Net Migration, and Columns G and H display international migration and domestic migration respectively. Columns I-O show the same information, but instead of the annual change, they show the cumulative population change from April 1, 2020 (the last Decennial Census) to July 1, 2022.
For my purposes, I’m only interested in the annual change from 2021 to 2022, and let’s use the example of Wake County. First, I can see in Column B, Row 98, that the Wake County population grew by an estimated 22,664 residents between July 1, 2021 and July 1, 2022. In Column C, I can see that of that growth, 6,141 new Wake County residents (27%) were babies born in Wake County. In Column F, I can see that 16,588 new Wake County residents (73%) moved into Wake County over the last year.
This file is also a useful tool for seeing how your county compares to others in terms of population growth and decline and how much of county population change is due to natural change or net migration.
Stay tuned for more information on where to access data specific to births, deaths, and migration if you want to do a deeper dive.
Need help understanding population change and its impacts on your community or business? Carolina Demography offers demographic research tailored to your needs.
Contact us today for a free initial consultation.
Contact UsCategories: Story Recipe

The Center for Women’s Health Research (CWHR) at the University of North Carolina School of Medicine released the 12th edition of our North Carolina Women’s Health Report Card on May 9, 2022. This document is a progress report on the…

Dr. Krista Perreira is a health economist who studies disparities in health, education, and economic well-being. In collaboration with the Urban Institute, she recently co-led a study funded by the Kate B. Reynolds Foundation to study barriers to access to…

Our material helped the NC Local News Lab Fund better understand and then prioritize their funding to better serve existing and future grant recipients in North Carolina. The North Carolina Local News Lab Fund was established in 2017 to strengthen…
Your support is critical to our mission of measuring, understanding, and predicting population change and its impact. Donate to Carolina Demography today.