This post examines changes in registered voters from the years 2013-2023. For an in depth analysis of North Carolina’s 7.3 million registered voters in 2023 and a breakdown of registered Republicans, Democrats, and Unaffiliated voters take a look at our earlier posts in our 2023 election series.
With another November election in the rearview, we wanted to see how North Carolina’s voters have changed over the past decade. Since 2013, North Carolina has experienced extensive migration and economic growth which has been accompanied with the addition of nearly one million additional registered voters.
How has that influx of new residents altered the composition of North Carolina registered voters? First, we will analyze the broad demographic changes within the North Carolina voting electorate as a whole. We will then look at the trends in partisan affiliation, and conclude with the evolving demographics within each individual major party.
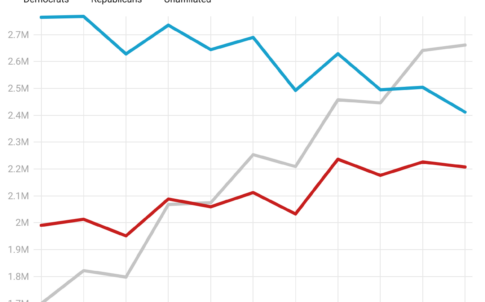
North Carolina has added nearly one million new registered voters since 2013. In that time span, there has been an increase of over 210,000 new Republican voters, a decrease of over 350,000 Democrats, and an increase of over 960,000 Unaffiliated voters.
In March 2022, Vincent Rottger looked at the rise of unaffiliated voters for Carolina Demography. A short recap: North Carolina voters were given the option of registering as unaffiliated starting in 1977. However, they could not vote in Democratic or Republican primaries until 1987, when the North Carolina General Assembly passed House Bill 559, providing the opportunity for major parties to offer Unaffiliated voters the chance to participate in their primaries. Republicans opened their primaries to Unaffiliated voters in 1988, and Democrats followed suit in 1996. Over the past 27 years, we’ve seen growth in voters choosing to register as unaffiliated.
North Carolina voters have become older, on average, over the last decade. Nearly a quarter of all registered voters in 2023 are 66 and older (23.4%) compared to just 18.2% in 2013. As the Baby Boomer generation has aged, the proportion of older voters has grown, signifying Baby Boomers remain one of the largest voting cohorts.
Likewise, an aging electorate matches the demographic change of the state, for North Carolina, as a whole, is aging due to below-replacement fertility rates. Overall, the state population is aging. The number of voters that are either 18-25 or 26-40 has varied only slightly over the last decade. Voters in the 41-65 age bracket have dwindled from 44.4% in 2013 to 39.6% in 2023.
Following overall population trends, the racial/ethnic composition of voters has shifted over the last decade. The overall percentage of White and Black voters decreased by 6.2 percent and 2.5 percent respectively, while the percentage of Asian, Hispanic, or Other voters increased in their overall percentage of the electorate. Voters identifying as an Undesignated race/ethnicity witnessed the largest expansion over the last decade, growing from 1.9% in 2013 to 7.7% in 2023. In the year 2020, Undesignated voters made up 9.3% of the electorate, nearly one-tenth of all voters.
Across all years in the analysis, rural counties, with less racial/ethnic diversity, tended to have higher concentrations of voters registered as Republicans. Counties that ranked in the top five for the highest percentage of Republican voters during the period of analysis included:
In general, counties with the highest concentrations of Republican voters were located in the Western half of North Carolina. Furthermore, the number of counties with more than 50% of voters registered Republican has increased from 5 to 8 over the last decade.
Meanwhile, more urban and racially/ethnically diverse counties tended to have higher concentrations of Democratic voters. The counties of:
were all ranked in the top 5 for the highest percentage of Democratic voters every year spanning 2013-2023.
In general, counties with the highest concentrations of Democratic voters were located in the Northeast part of the state. Additionally, the number of counties with more than 50% of voters registered Democrat has decreased from 32 to 10 counties over the last decade.
In regards to geography, there are less clear trends among counties with high concentrations of Unaffiliated voters. Unaffiliated voters are dispersed across North Carolina, and the counties with the highest concentrations vary from year to year.
Beyond the shifts in voter partisan affiliation, there are several trends of note regarding the makeup of each party as well. Democratic voters today maintain a similar percentage of 18-25 year-olds (10.5%) and 26-40 year-olds (23.5%) registered within their party as they did over a decade ago with 10.9% of Democrats being 18-25 years old and 22.9% being 26-40 years olds. However, the Democratic party today is slightly older in composition than it was a decade ago. Nearly 27% of the party today is voters 66 and older compared to 21.5% in 2013.
Unaffiliated registration dominates every racial/ethnic group except White and Black individuals, who are plurality-Republican and plurality-Democrat, respectively. Over the past ten years, Black voters have overwhelmingly identified as Democrats. Yet, while 84.7% of all Black voters did identify as Democrat in 2013, this figure has gradually declined to where only 75.4% of all Black voters identify as Democrat in 2023. Much of this decline can be attributed to the upward trajectory of Black unaffiliated voters, moving from 12.7% in 2013 to 21.7% in 2023. Moreover, the Democratic party gradually gained a higher proportion of Asian, Hispanic, and Undesignated voters in that same period.
Republicans have aged similarly to Democrats. Over the last decade, 18-25-year-olds represented between 9.2 and 9.9.% of the Republican party. In 2023, 18-25-year-olds comprised 9.3% of Republicans. Although there has been some decline in percentages, those in the 26-40 age bracket comprise a similar share of the Republican party as they did in 2013 (21.8% v. 19.5%). Yet, those in the 41-65 age bracket comprise just over 5% less of the Republican party in 2023 than they did in 2013 (48.6% v. 43.4%). The only age group that has consistently grown in representation for the Republican party is the 66 and above age bracket. This group has grown in prominence in the Republican party in each consecutive year since 2013. However, overall, the percentage of voters 66 and over in both the Republican and Democratic parties are quite similar with Republicans having 27.8% compared to Democrat’s 27% share.
Republican voters have a higher proportion of White voters on average in comparison to the electorate as a whole. In 2013, those identifying as White comprised 70.5% of the entire electorate and 94.5% of the Republican party. In 2023, White voters comprised 64.3% of the statewide electorate and also 88.2% of the Republican party. The only race/ethnic "group" other than White that has accounted for more than 2% of the Republican party in the past decade are those opting not to identify and being marked as an Undesignated race/ethnicity. Those categorized as Undesignated have risen slightly over the decade from just under 1% in 2013 to 5.7% in 2023. Additionally, the proportion of those identifying as American Indian, Hispanic, or Asian in the Republican party has risen over the past ten years. However, as mentioned, no race or ethnicity other than White and Undesignated comprised more than 2% of the Republican party during the frame of analysis.
Unaffiliated voters have remained the most dynamic and in flux of all three parties/categories, largely due to their expansive growth, over the last decade. Every age bracket registers more Unaffiliated in 2023 than they did when compared to 2013. Additionally, nearly 50% of all 18-25 year old voters are registered as Unaffiliated in 2023, whereas only 37.2% of 18-25 year old voters identified as Unaffiliated in 2013. Likewise, over 43% of 26-40-year-olds in 2023 identify as Unaffiliated compared to 33.3% in 2013. Additionally, across all 11 years in this analysis, voters in the 18-25 and 26-40 age brackets comprised a greater proportion of the Unaffiliated voters in comparison to the electorate as a whole.
Thus, the Unaffiliated category is generally younger on average and boasts a larger proportion of younger voters than either the Republican or Democratic party. Over a quarter of both the 41-65 and 66 and over age brackets also identify as Unaffiliated today. In 2013 only 23.1% of 41-65-year-olds were registered Unaffiliated and 16.8% of voters 66 and over. Overall, across every age bracket, there has been a decline in the proportion of individuals identifying as Republican and Democrat in favor of the Unaffiliated identification. The one exception to this trend is voters age 66 and older identifying as Republican as 33.1% of those 66 and older identified as Republican in 2013 compared to 35.8% in 2023. Ultimately, it appears the Unaffiliated designation has pulled voters across a majority of age brackets away from the two major parties to some extent.
Voters identifying as White have been the majority of unaffiliated voters consistently for the last ten years. However, Unaffiliated voters have gradually become more diverse over the last decade. White voters dropped from nearly 78% in 2013 to 66.3% in 2013. Black, Hispanic, and Asian voters have increased their share of all unaffiliated voters. In particular, Hispanic and Asian voters have consistently made up a larger share of unaffiliated voters in comparison to the electorate as a whole.
One of the most notable findings over the last decade is the increasing prevalence of voters not responding to the race and ethnicity questions on the voter registration form. Undesignated voters make up over one-tenth of the Unaffiliated voters today, yet over ten years ago they just represented 3.7% of unaffiliated voters. When registering in North Carolina, voters are not required to list their race/ethnicity, leaving these voters to be marked as Undesignated. Although we do not presently have access to data that would inform why this sharp uptick in Undesignated race/ethnicity is occurring, this increase could have several implications. This could be a reflection of a shifting understanding of racial and ethnic identities, a reflection of potential voter fears about race/ethnicity being used to block access to the polls, or a rise in general distrust surrounding the current election system.
Note: The analysis presented is of Historical Registered Voting Stats for each November election spanning from 2013 to 2022 and the 9/23/2023 current voter registration file from NC’s State Board of Elections. Analysis is limited to individuals who are active or inactive registered voters. 2023 data excludes voters with a reported birth age of 116 years or older who were excluded from the age analysis. Additionally, 2023 data excludes voters with registration dates prior to 1930.
Need help understanding population change and its impacts on your community or business? Carolina Demography offers demographic research tailored to your needs.
Contact us today for a free initial consultation.
Contact UsCategories: Elections & Voting

The Center for Women’s Health Research (CWHR) at the University of North Carolina School of Medicine released the 12th edition of our North Carolina Women’s Health Report Card on May 9, 2022. This document is a progress report on the…

Dr. Krista Perreira is a health economist who studies disparities in health, education, and economic well-being. In collaboration with the Urban Institute, she recently co-led a study funded by the Kate B. Reynolds Foundation to study barriers to access to…

Our material helped the NC Local News Lab Fund better understand and then prioritize their funding to better serve existing and future grant recipients in North Carolina. The North Carolina Local News Lab Fund was established in 2017 to strengthen…
Your support is critical to our mission of measuring, understanding, and predicting population change and its impact. Donate to Carolina Demography today.