October 27th was the last day for North Carolina voters to request an absentee ballot by mail for the November 3, 2020 election. Early voting ends in North Carolina on Saturday, October 31st.
With six days remaining before Election Day, half of North Carolina’s 7.3 million registered voters have already voted:
In this post, we break down how this varies by key demographic characteristics, such as party affiliation, sex, age, and race/ethnicity, and by county.
Party Affiliation
More than half of North Carolina’s registered Democrats (55%) and Republicans (51%) have already voted. Republicans have been more likely to vote early using one-stop than Democrats (44% vs. 40%), while Democrats have been twice as likely as Republicans to vote absentee by mail.
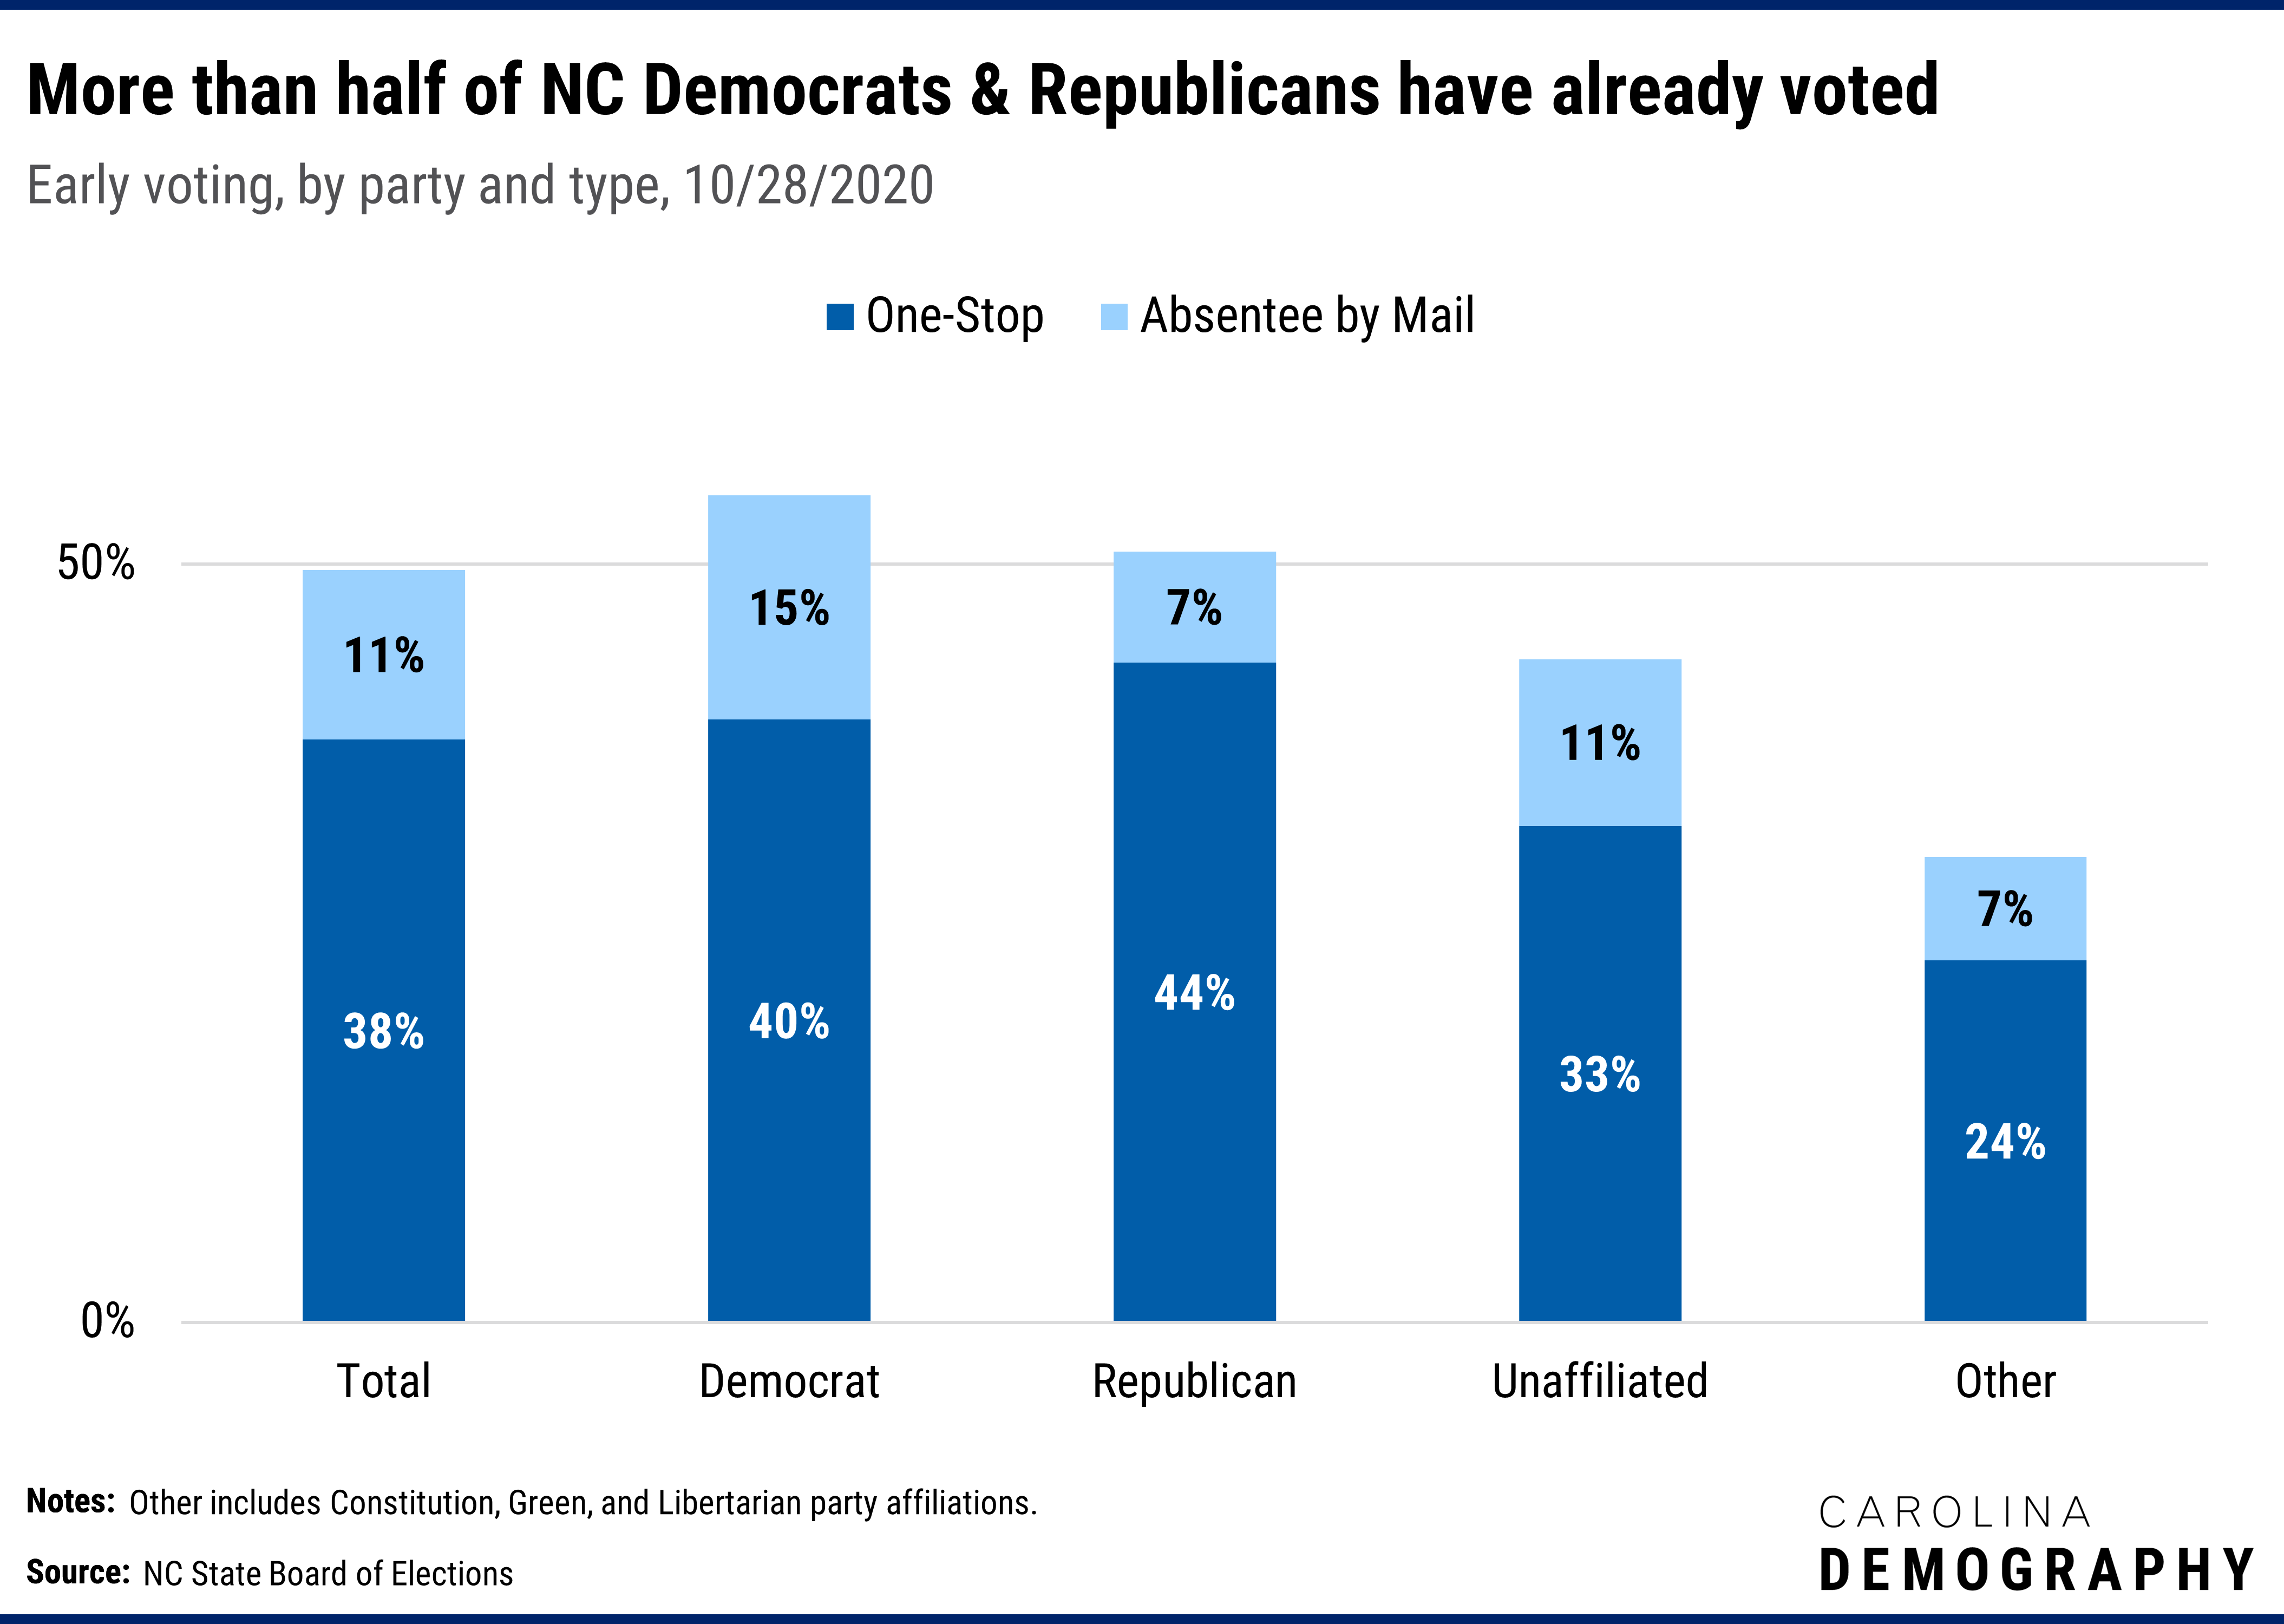
A smaller share of unaffiliated voters have already voted, largely because of lower early voting rates (33%). This pattern likely reflects their relatively younger age, as voters age 40 and under are much less likely to have voted already compared to voters over age 40.
Sex
Compared to men, women are more likely to have voted early using one-stop (40% vs. 38%) and more likely to have voted already by absentee ballot (12% vs. 11%). In total, 52% of North Carolina women have already voted versus 48% of North Carolina men.
Age
Electoral participation tends to increase with age: older individuals are more likely to register to vote and more likely to turn out to vote. This relationship between participation and age is strongly pronounced in early voting patterns: as of October 28th, nearly seven in ten North Carolina voters over age 65 have already voted, more than twice the share of younger voters.
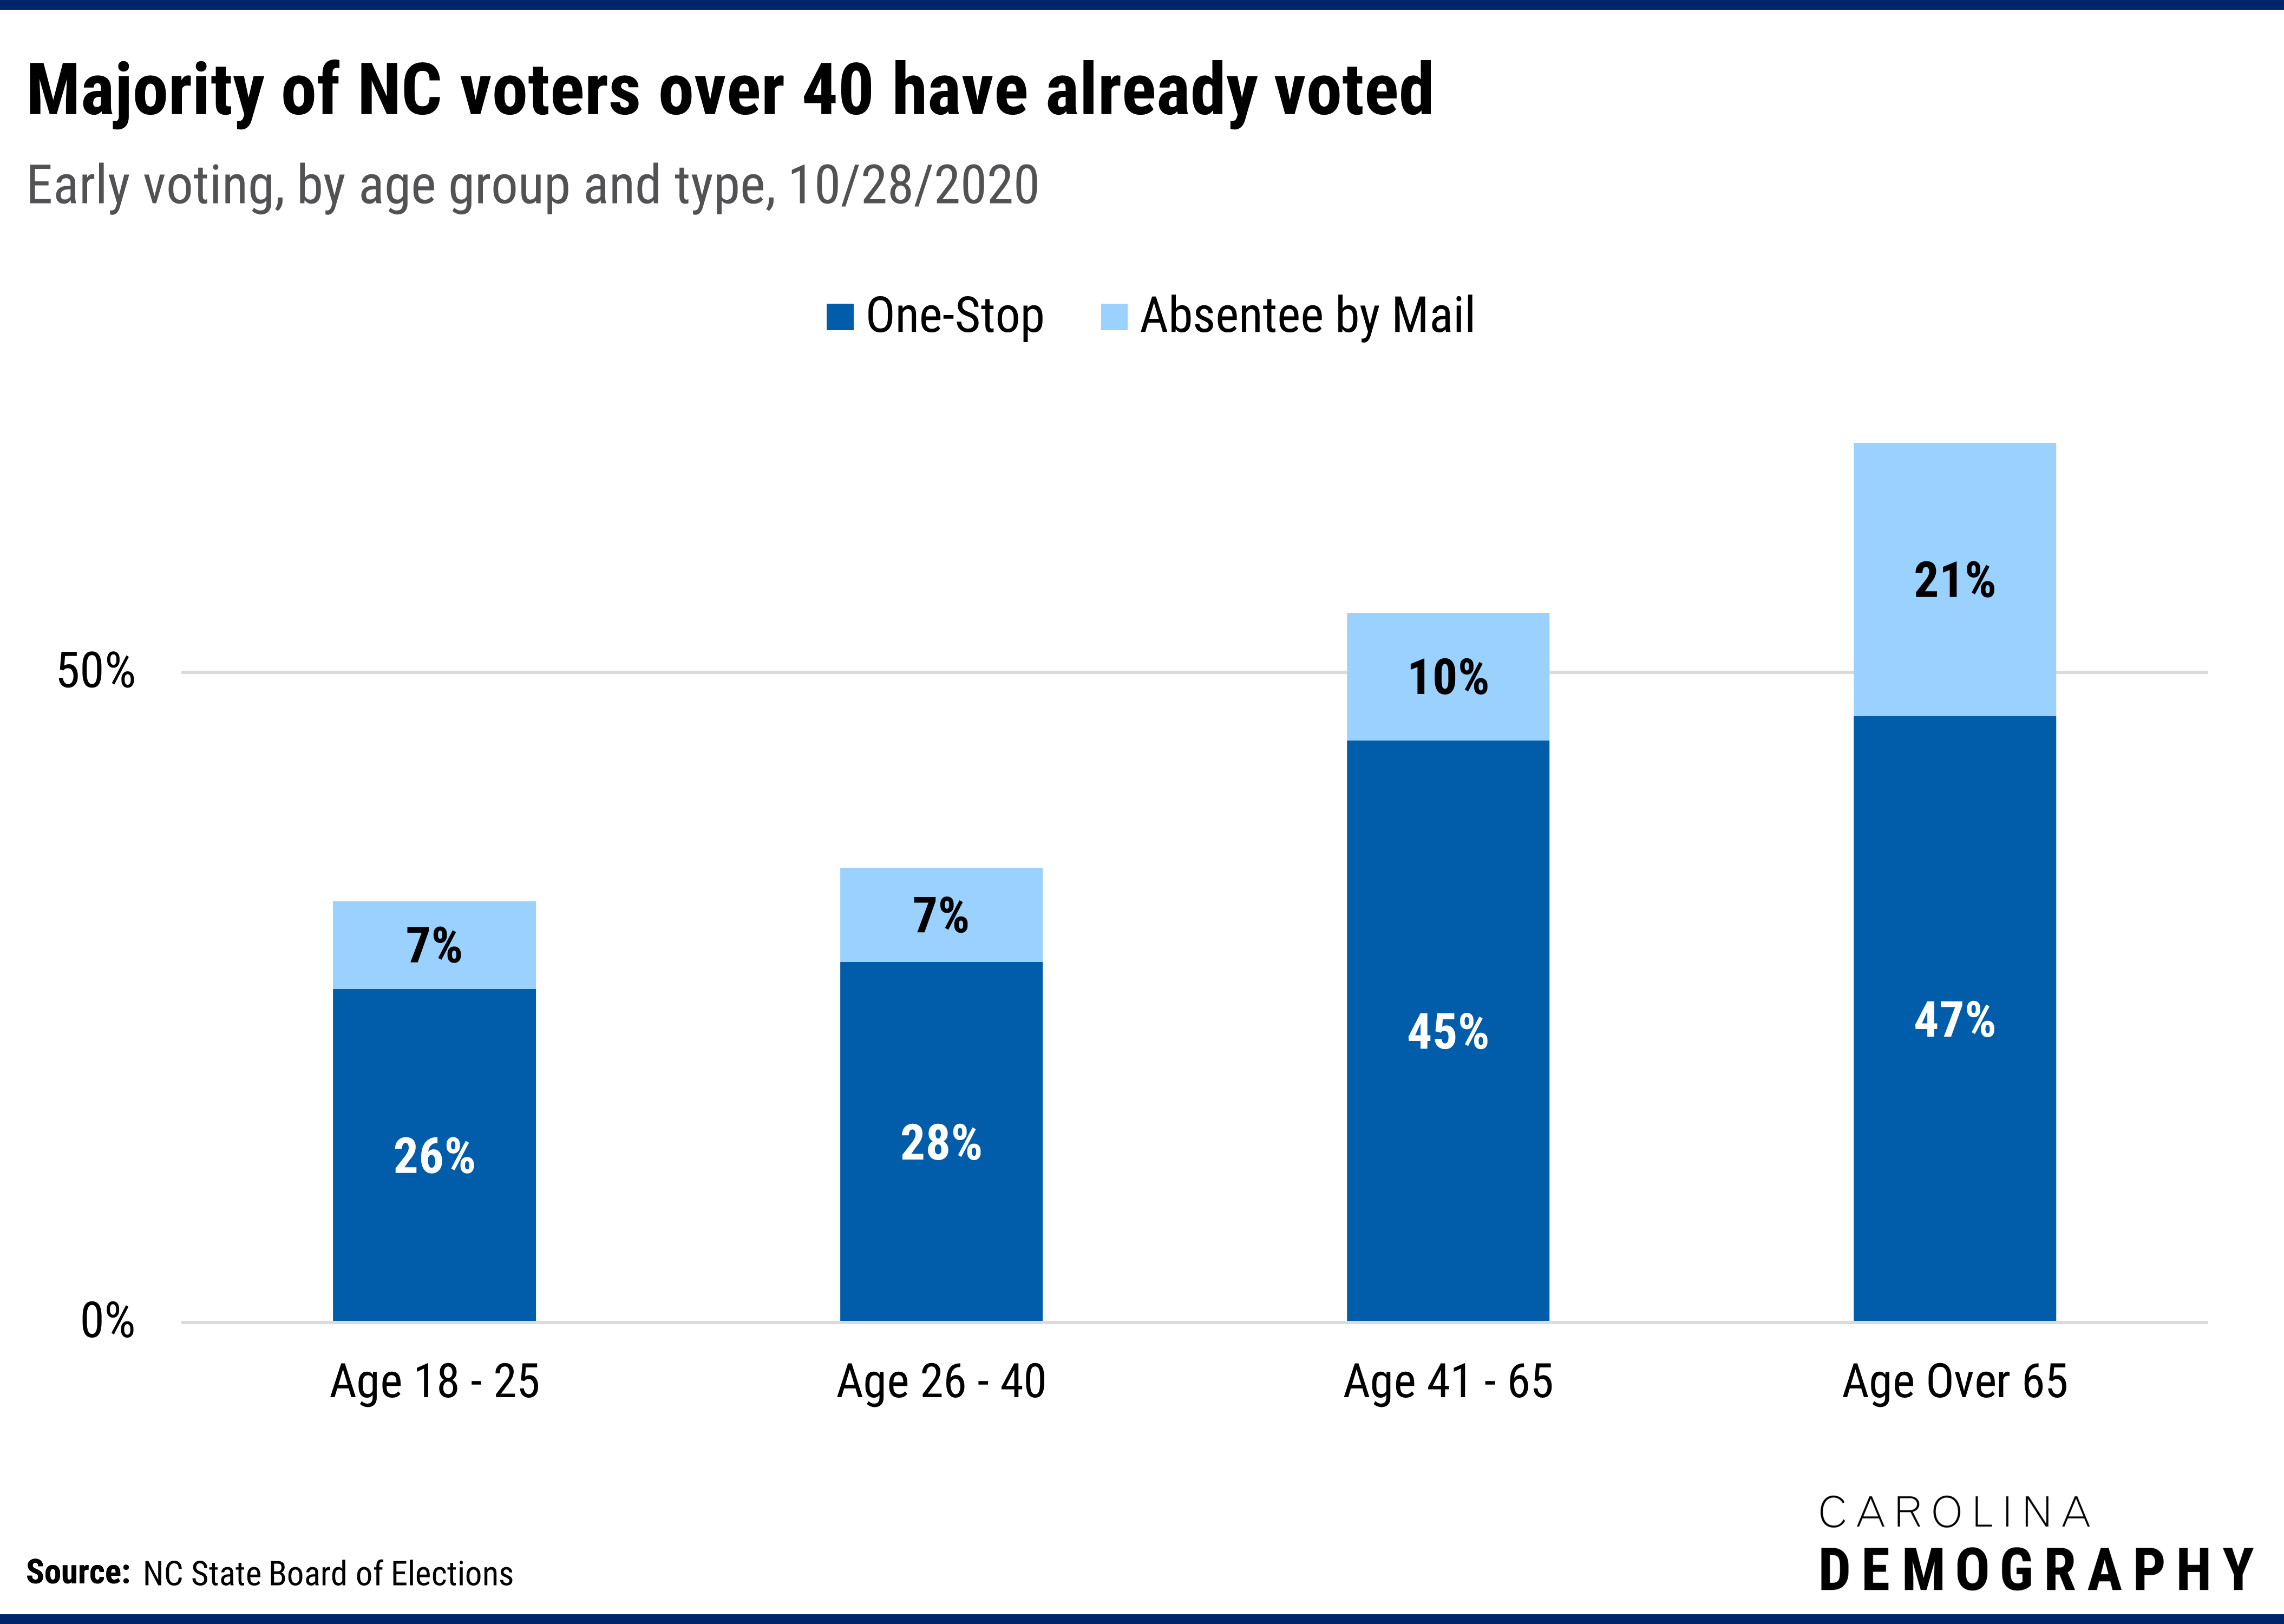
Older voters in North Carolina are both more likely to have voted early (47%) and more likely to have voted absentee (21%), followed by voters ages 41-65. In contrast to voters over 40, only about one-third of voters age 40 and under have voted already. Just over one in four voters age 40 and under have voted early and 7% have voted absentee by mail.
Race/Ethnicity
Among voters reporting race and ethnicity, white voters are the most likely to have voted already (52%), followed by Asian or Native Hawaiian/Pacific Islander voters (50%) and Black voters (48%). White and Black voter turnout is largely due to high levels of one-stop early voting (40%), while Asian voter turnout has been fueled by very high absentee by mail participation (20%).
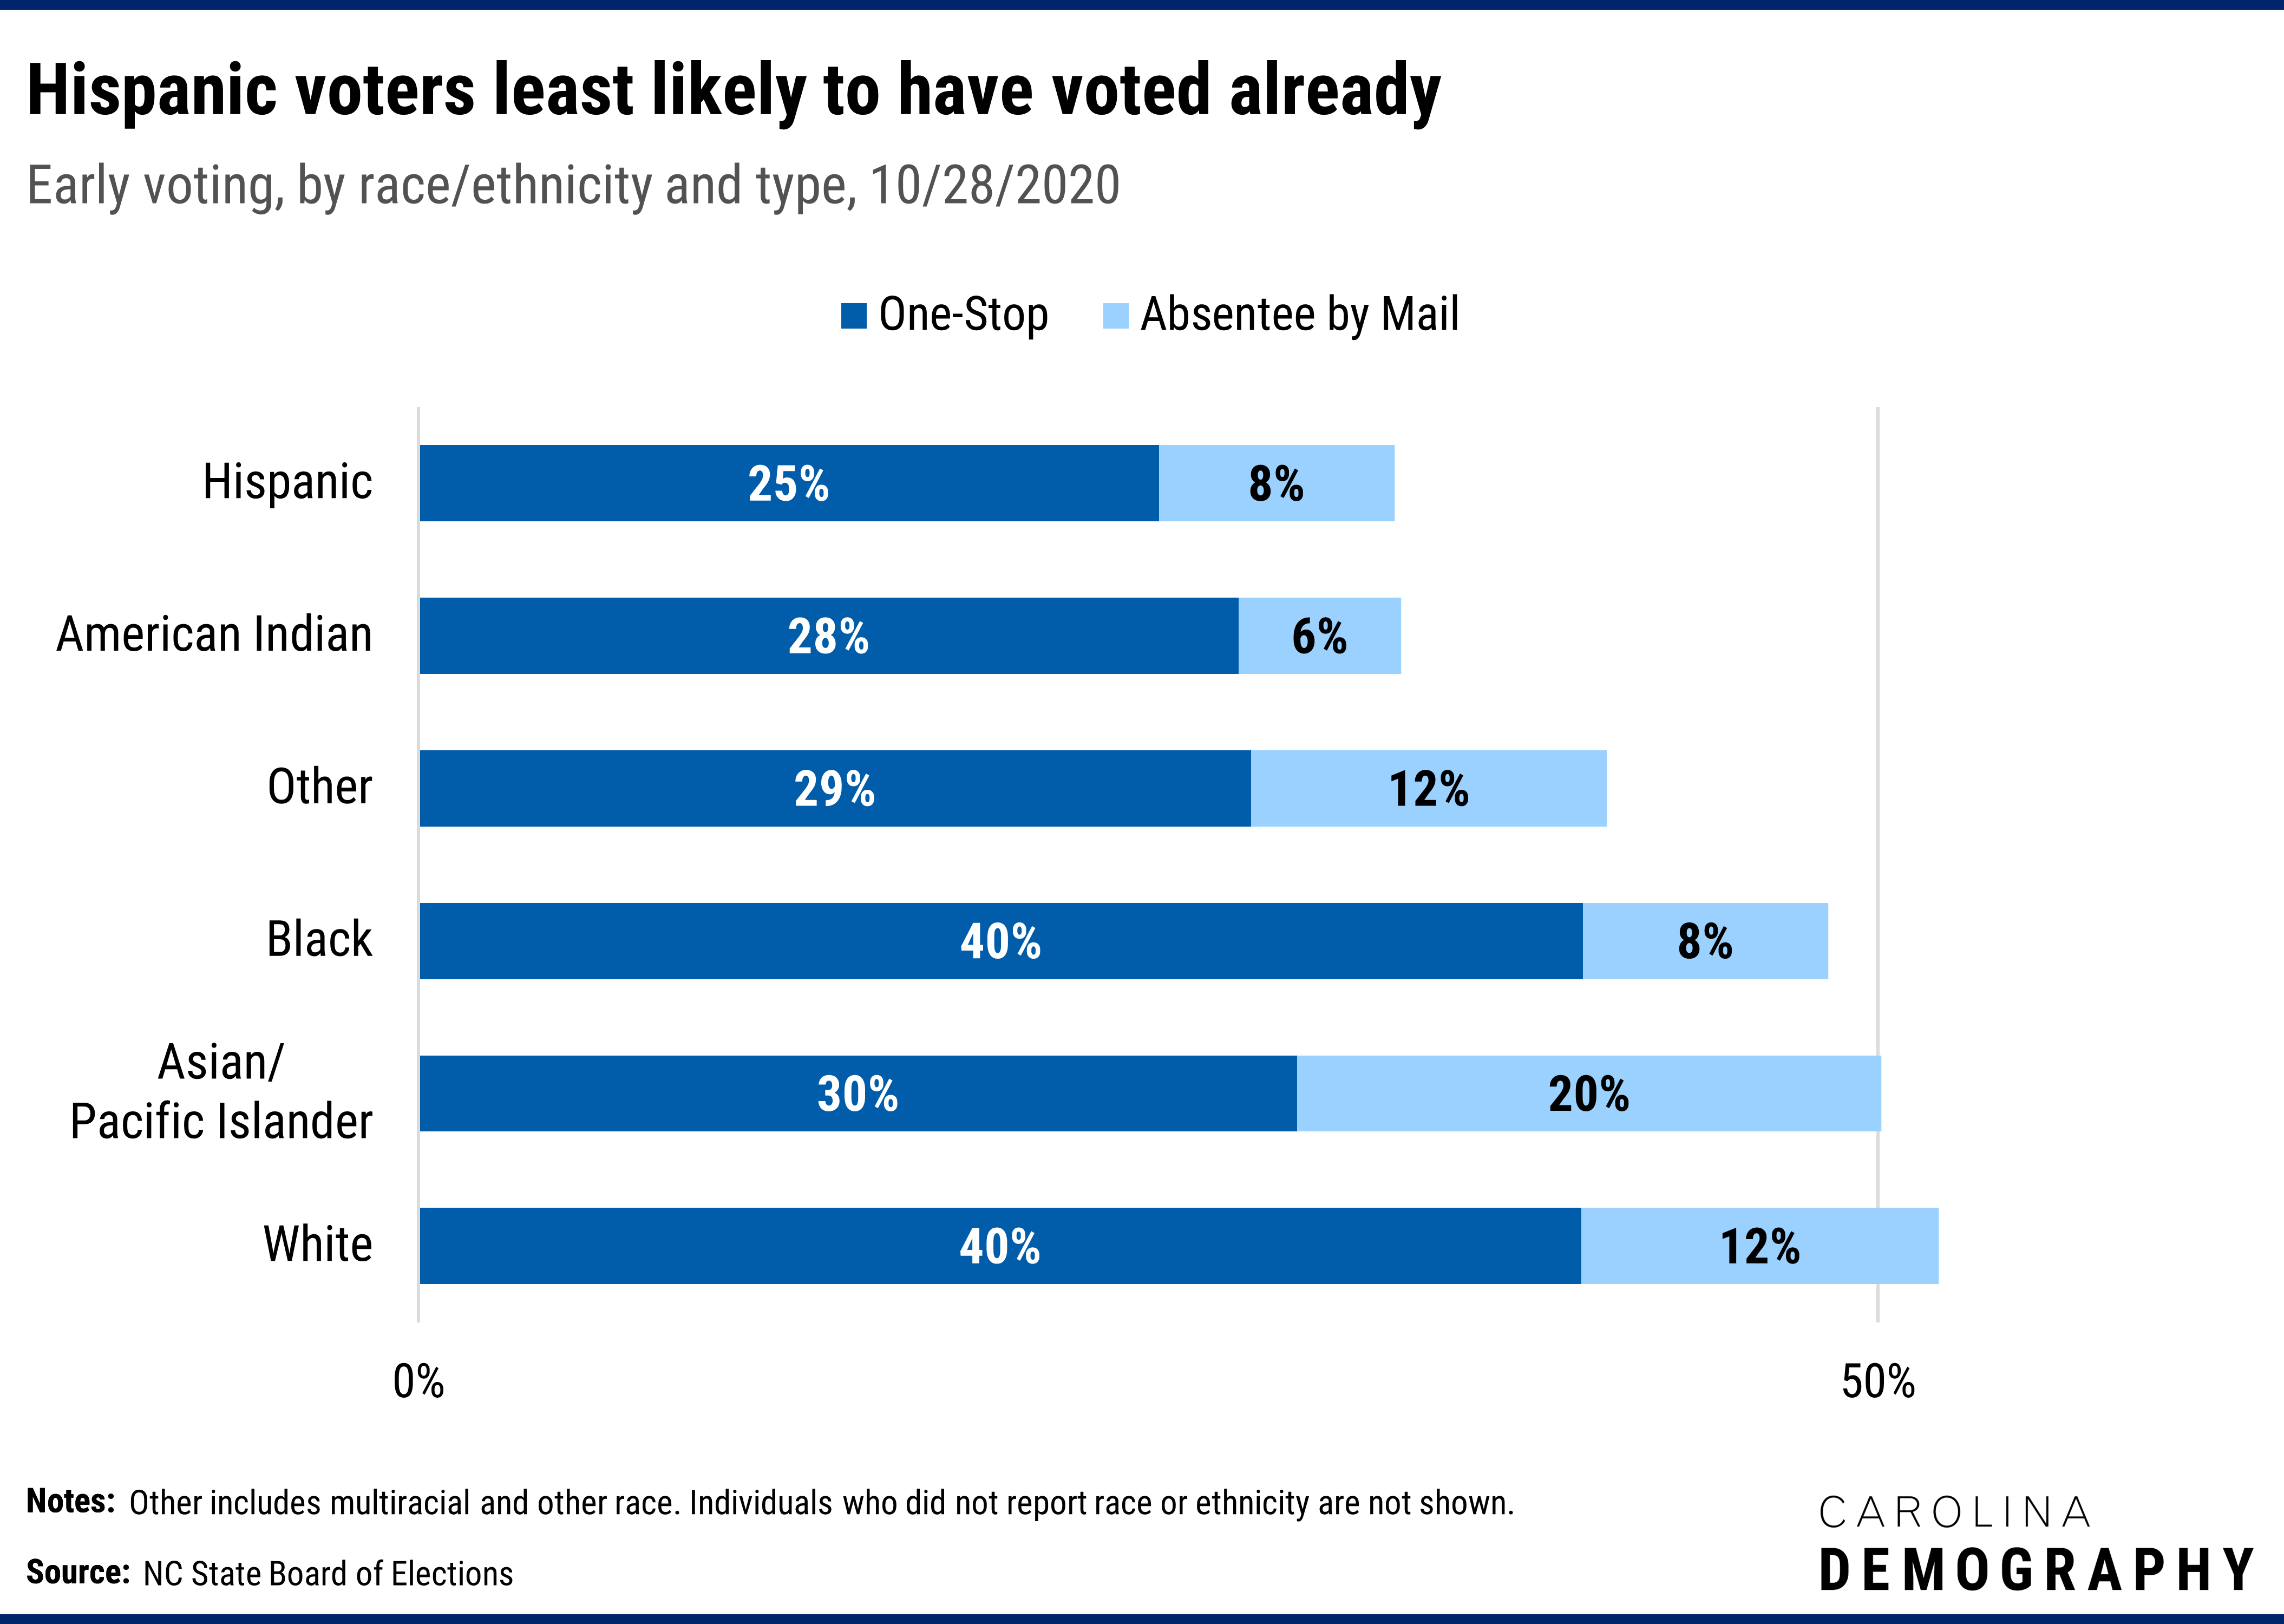
In contrast, Hispanic and American Indian voters have been significantly less likely to participate in early voting and have been less likely to vote absentee by mail. For Hispanic voters, these patterns are likely influenced by age: 30% of North Carolina’s registered Hispanic voters are ages 18-25. Age is not a clear factor driving turnout for American Indian voters.
County
More than half of registered voters in 37 North Carolina counties have already voted using either early voting or absentee by mail. Chatham has the highest voter turnout so far (64%), followed by Orange (57.3%), Durham (56.9%), Brunswick (56.5%), and Buncombe (56.0%). These high turnout rates are largely fueled by high levels of absentee voting.
In contrast, less than one in three voters in three NC counties—Duplin, Hyde, and Robeson—have participated in the 2020 election. These counties have the lowest rates of early voting statewide.
| County | Registered Voters | Total Voted | Early Votes | Absentee Votes | Percent Voted | Percent Voted Early | Percent Voted Absentee |
|---|---|---|---|---|---|---|---|
| Alamance | 110,127 | 52,434 | 39,665 | 12,769 | 47.6% | 36.0% | 11.6% |
| Alexander | 24,773 | 13,856 | 12,307 | 1,549 | 55.9% | 49.7% | 6.3% |
| Alleghany | 7,556 | 4,101 | 3,446 | 655 | 54.3% | 45.6% | 8.7% |
| Anson | 16,530 | 6,194 | 5,540 | 654 | 37.5% | 33.5% | 4.0% |
| Ashe | 19,414 | 8,428 | 6,675 | 1,753 | 43.4% | 34.4% | 9.0% |
| Avery | 12,298 | 4,531 | 3,736 | 795 | 36.8% | 30.4% | 6.5% |
| Beaufort | 33,781 | 16,270 | 13,662 | 2,608 | 48.2% | 40.4% | 7.7% |
| Bertie | 13,213 | 6,369 | 5,732 | 637 | 48.2% | 43.4% | 4.8% |
| Bladen | 22,786 | 10,888 | 9,740 | 1,148 | 47.8% | 42.7% | 5.0% |
| Brunswick | 114,115 | 64,449 | 48,327 | 16,122 | 56.5% | 42.3% | 14.1% |
| Buncombe | 206,178 | 115,553 | 84,868 | 30,685 | 56.0% | 41.2% | 14.9% |
| Burke | 57,848 | 29,743 | 25,282 | 4,461 | 51.4% | 43.7% | 7.7% |
| Cabarrus | 149,584 | 74,395 | 57,804 | 16,591 | 49.7% | 38.6% | 11.1% |
| Caldwell | 54,147 | 29,143 | 24,920 | 4,223 | 53.8% | 46.0% | 7.8% |
| Camden | 8,128 | 3,472 | 3,057 | 415 | 42.7% | 37.6% | 5.1% |
| Carteret | 51,689 | 27,537 | 23,314 | 4,223 | 53.3% | 45.1% | 8.2% |
| Caswell | 15,402 | 6,259 | 5,161 | 1,098 | 40.6% | 33.5% | 7.1% |
| Catawba | 108,098 | 55,018 | 46,141 | 8,877 | 50.9% | 42.7% | 8.2% |
| Chatham | 57,655 | 36,642 | 25,541 | 11,101 | 63.6% | 44.3% | 19.3% |
| Cherokee | 22,597 | 9,297 | 7,479 | 1,818 | 41.1% | 33.1% | 8.0% |
| Chowan | 10,262 | 5,388 | 4,674 | 714 | 52.5% | 45.5% | 7.0% |
| Clay | 9,112 | 4,287 | 3,621 | 666 | 47.0% | 39.7% | 7.3% |
| Cleveland | 67,168 | 32,997 | 28,194 | 4,803 | 49.1% | 42.0% | 7.2% |
| Columbus | 36,642 | 13,973 | 12,386 | 1,587 | 38.1% | 33.8% | 4.3% |
| Craven | 72,642 | 35,429 | 27,607 | 7,822 | 48.8% | 38.0% | 10.8% |
| Cumberland | 225,029 | 95,903 | 76,724 | 19,179 | 42.6% | 34.1% | 8.5% |
| Currituck | 21,803 | 7,536 | 6,515 | 1,021 | 34.6% | 29.9% | 4.7% |
| Dare | 29,953 | 14,878 | 11,689 | 3,189 | 49.7% | 39.0% | 10.6% |
| Davidson | 112,872 | 54,040 | 44,115 | 9,925 | 47.9% | 39.1% | 8.8% |
| Davie | 31,345 | 16,164 | 13,559 | 2,605 | 51.6% | 43.3% | 8.3% |
| Duplin | 30,596 | 9,272 | 7,968 | 1,304 | 30.3% | 26.0% | 4.3% |
| Durham | 243,045 | 138,264 | 96,845 | 41,419 | 56.9% | 39.8% | 17.0% |
| Edgecombe | 35,355 | 16,031 | 14,144 | 1,887 | 45.3% | 40.0% | 5.3% |
| Forsyth | 270,818 | 134,770 | 99,181 | 35,589 | 49.8% | 36.6% | 13.1% |
| Franklin | 47,282 | 23,754 | 19,847 | 3,907 | 50.2% | 42.0% | 8.3% |
| Gaston | 150,779 | 76,797 | 63,512 | 13,285 | 50.9% | 42.1% | 8.8% |
| Gates | 8,294 | 3,105 | 2,629 | 476 | 37.4% | 31.7% | 5.7% |
| Graham | 6,038 | 2,779 | 2,462 | 317 | 46.0% | 40.8% | 5.3% |
| Granville | 39,806 | 20,902 | 17,218 | 3,684 | 52.5% | 43.3% | 9.3% |
| Greene | 11,311 | 5,328 | 4,520 | 808 | 47.1% | 40.0% | 7.1% |
| Guilford | 381,797 | 190,530 | 148,490 | 42,040 | 49.9% | 38.9% | 11.0% |
| Halifax | 37,345 | 14,807 | 13,109 | 1,698 | 39.6% | 35.1% | 4.5% |
| Harnett | 81,357 | 37,925 | 31,065 | 6,860 | 46.6% | 38.2% | 8.4% |
| Haywood | 46,171 | 23,776 | 18,255 | 5,521 | 51.5% | 39.5% | 12.0% |
| Henderson | 87,191 | 47,076 | 33,259 | 13,817 | 54.0% | 38.1% | 15.8% |
| Hertford | 14,945 | 6,955 | 6,090 | 865 | 46.5% | 40.7% | 5.8% |
| Hoke | 33,040 | 13,651 | 11,417 | 2,234 | 41.3% | 34.6% | 6.8% |
| Hyde | 3,150 | 1,000 | 816 | 184 | 31.7% | 25.9% | 5.8% |
| Iredell | 130,013 | 67,128 | 52,355 | 14,773 | 51.6% | 40.3% | 11.4% |
| Jackson | 29,253 | 13,519 | 11,040 | 2,479 | 46.2% | 37.7% | 8.5% |
| Johnston | 142,255 | 70,426 | 57,263 | 13,163 | 49.5% | 40.3% | 9.3% |
| Jones | 7,368 | 2,994 | 2,628 | 366 | 40.6% | 35.7% | 5.0% |
| Lee | 38,379 | 19,512 | 16,148 | 3,364 | 50.8% | 42.1% | 8.8% |
| Lenoir | 38,203 | 19,235 | 16,545 | 2,690 | 50.3% | 43.3% | 7.0% |
| Lincoln | 61,985 | 32,740 | 27,592 | 5,148 | 52.8% | 44.5% | 8.3% |
| Macon | 27,089 | 13,769 | 10,561 | 3,208 | 50.8% | 39.0% | 11.8% |
| Madison | 17,136 | 8,258 | 6,735 | 1,523 | 48.2% | 39.3% | 8.9% |
| Martin | 16,412 | 6,900 | 5,938 | 962 | 42.0% | 36.2% | 5.9% |
| Mcdowell | 29,699 | 13,427 | 11,079 | 2,348 | 45.2% | 37.3% | 7.9% |
| Mecklenburg | 789,547 | 393,988 | 284,974 | 109,014 | 49.9% | 36.1% | 13.8% |
| Mitchell | 11,017 | 6,125 | 5,197 | 928 | 55.6% | 47.2% | 8.4% |
| Montgomery | 16,913 | 7,075 | 6,137 | 938 | 41.8% | 36.3% | 5.5% |
| Moore | 73,559 | 38,694 | 28,959 | 9,735 | 52.6% | 39.4% | 13.2% |
| Nash | 68,053 | 34,115 | 29,354 | 4,761 | 50.1% | 43.1% | 7.0% |
| New Hanover | 177,056 | 90,665 | 68,106 | 22,559 | 51.2% | 38.5% | 12.7% |
| Northampton | 13,891 | 6,196 | 5,370 | 826 | 44.6% | 38.7% | 5.9% |
| Onslow | 116,300 | 43,532 | 36,276 | 7,256 | 37.4% | 31.2% | 6.2% |
| Orange | 111,765 | 64,016 | 41,212 | 22,804 | 57.3% | 36.9% | 20.4% |
| Pamlico | 9,722 | 4,833 | 3,862 | 971 | 49.7% | 39.7% | 10.0% |
| Pasquotank | 28,521 | 12,576 | 10,672 | 1,904 | 44.1% | 37.4% | 6.7% |
| Pender | 44,358 | 22,791 | 19,398 | 3,393 | 51.4% | 43.7% | 7.6% |
| Perquimans | 9,634 | 5,004 | 4,570 | 434 | 51.9% | 47.4% | 4.5% |
| Person | 27,565 | 13,708 | 11,782 | 1,926 | 49.7% | 42.7% | 7.0% |
| Pitt | 122,925 | 57,304 | 48,073 | 9,231 | 46.6% | 39.1% | 7.5% |
| Polk | 16,430 | 8,263 | 5,949 | 2,314 | 50.3% | 36.2% | 14.1% |
| Randolph | 93,853 | 44,446 | 38,391 | 6,055 | 47.4% | 40.9% | 6.5% |
| Richmond | 29,178 | 13,070 | 11,532 | 1,538 | 44.8% | 39.5% | 5.3% |
| Robeson | 76,016 | 24,454 | 21,448 | 3,006 | 32.2% | 28.2% | 4.0% |
| Rockingham | 61,677 | 28,969 | 25,301 | 3,668 | 47.0% | 41.0% | 5.9% |
| Rowan | 96,903 | 44,998 | 36,331 | 8,667 | 46.4% | 37.5% | 8.9% |
| Rutherford | 45,691 | 20,730 | 17,246 | 3,484 | 45.4% | 37.7% | 7.6% |
| Sampson | 37,568 | 17,985 | 16,203 | 1,782 | 47.9% | 43.1% | 4.7% |
| Scotland | 21,896 | 9,622 | 8,313 | 1,309 | 43.9% | 38.0% | 6.0% |
| Stanly | 42,697 | 21,457 | 18,478 | 2,979 | 50.3% | 43.3% | 7.0% |
| Stokes | 31,649 | 14,444 | 12,284 | 2,160 | 45.6% | 38.8% | 6.8% |
| Surry | 46,666 | 23,660 | 19,301 | 4,359 | 50.7% | 41.4% | 9.3% |
| Swain | 10,010 | 4,121 | 3,492 | 629 | 41.2% | 34.9% | 6.3% |
| Transylvania | 26,412 | 14,071 | 10,536 | 3,535 | 53.3% | 39.9% | 13.4% |
| Tyrrell | 2,380 | 905 | 831 | 74 | 38.0% | 34.9% | 3.1% |
| Union | 167,068 | 84,660 | 69,736 | 14,924 | 50.7% | 41.7% | 8.9% |
| Vance | 29,443 | 13,936 | 11,834 | 2,102 | 47.3% | 40.2% | 7.1% |
| Wake | 791,821 | 421,180 | 283,478 | 137,702 | 53.2% | 35.8% | 17.4% |
| Warren | 13,441 | 6,878 | 5,686 | 1,192 | 51.2% | 42.3% | 8.9% |
| Washington | 8,289 | 4,035 | 3,451 | 584 | 48.7% | 41.6% | 7.0% |
| Watauga | 44,949 | 21,713 | 17,270 | 4,443 | 48.3% | 38.4% | 9.9% |
| Wayne | 75,483 | 36,699 | 30,883 | 5,816 | 48.6% | 40.9% | 7.7% |
| Wilkes | 43,511 | 18,342 | 14,563 | 3,779 | 42.2% | 33.5% | 8.7% |
| Wilson | 56,923 | 24,539 | 20,821 | 3,718 | 43.1% | 36.6% | 6.5% |
| Yadkin | 24,611 | 10,610 | 8,741 | 1,869 | 43.1% | 35.5% | 7.6% |
| Yancey | 14,086 | 7,351 | 5,969 | 1,382 | 52.2% | 42.4% | 9.8% |
Data Source: NC State Board of Elections. Files used in this analysis include the 10/24/2020 registered voter file (analysis limited to Active, Inactive, and Temporary voter records and absentee ballot return file (10/28/2020).
Need help understanding population change and its impacts on your community or business? Carolina Demography offers demographic research tailored to your needs.
Contact us today for a free initial consultation.
Contact UsCategories: Elections & Voting

The Center for Women’s Health Research (CWHR) at the University of North Carolina School of Medicine released the 12th edition of our North Carolina Women’s Health Report Card on May 9, 2022. This document is a progress report on the…

Dr. Krista Perreira is a health economist who studies disparities in health, education, and economic well-being. In collaboration with the Urban Institute, she recently co-led a study funded by the Kate B. Reynolds Foundation to study barriers to access to…

Our material helped the NC Local News Lab Fund better understand and then prioritize their funding to better serve existing and future grant recipients in North Carolina. The North Carolina Local News Lab Fund was established in 2017 to strengthen…
Your support is critical to our mission of measuring, understanding, and predicting population change and its impact. Donate to Carolina Demography today.