A poll released last month by the Kaiser Family Foundation indicated that a growing number of people in the United States indicate that they have or will receive at least one dose of a COVID-19 vaccine. But there are still many people who are hesitant to get the vaccine.
The CDC recently released an interactive map estimating how hesitant areas are across the United States to receive the vaccine. The map estimates the population that will “probably not” or “definitely not” get the vaccine.
In North Carolina, the counties that are estimated to be the most hesitant are Robeson and Onslow counties (24%).
In addition, the U.S. Census Bureau released detailed data about vaccine hesitancy differences across population groups. This data comes from the U.S. Census Bureau’s Household Pulse Survey (HPS), an ongoing survey to track the impacts of the COVID-19 pandemic on the United States. To explore data at the national level, visit the Bureau’s new Vaccination Tracker. Please note that this data is a more expansive definition of vaccine hesitancy than used in the CDC map; it includes individuals who “probably” will not get the vaccine and those who report that they will not get all recommended doses.
The data below present a snapshot of North Carolina based on the most recent data: March 17 to March 29, 2021.
Seventy percent of North Carolina adults ages 18 and over—nearly 5.7 million individuals—reported that they either have received a vaccine (and have or plan to get all doses) or “will definitely” get a vaccine. Older, more educated, or higher income adults were more likely to report vaccination or intent to be vaccinated.
Because the Household Pulse Survey is an internet-based survey, the survey respondents may be more likely to have higher education and income then the population overall, as these are factors associated with internet access. As a result, the true share of individuals vaccinated or willing to be vaccinated may be lower than the HPS estimate. For example, 49% of North Carolina adults reported that they had been partially vaccinated in the March 17-29 HPS data; NC DHHS reported that 42% of North Carolina adults had been at least partially vaccinated as of April 13, 2021.
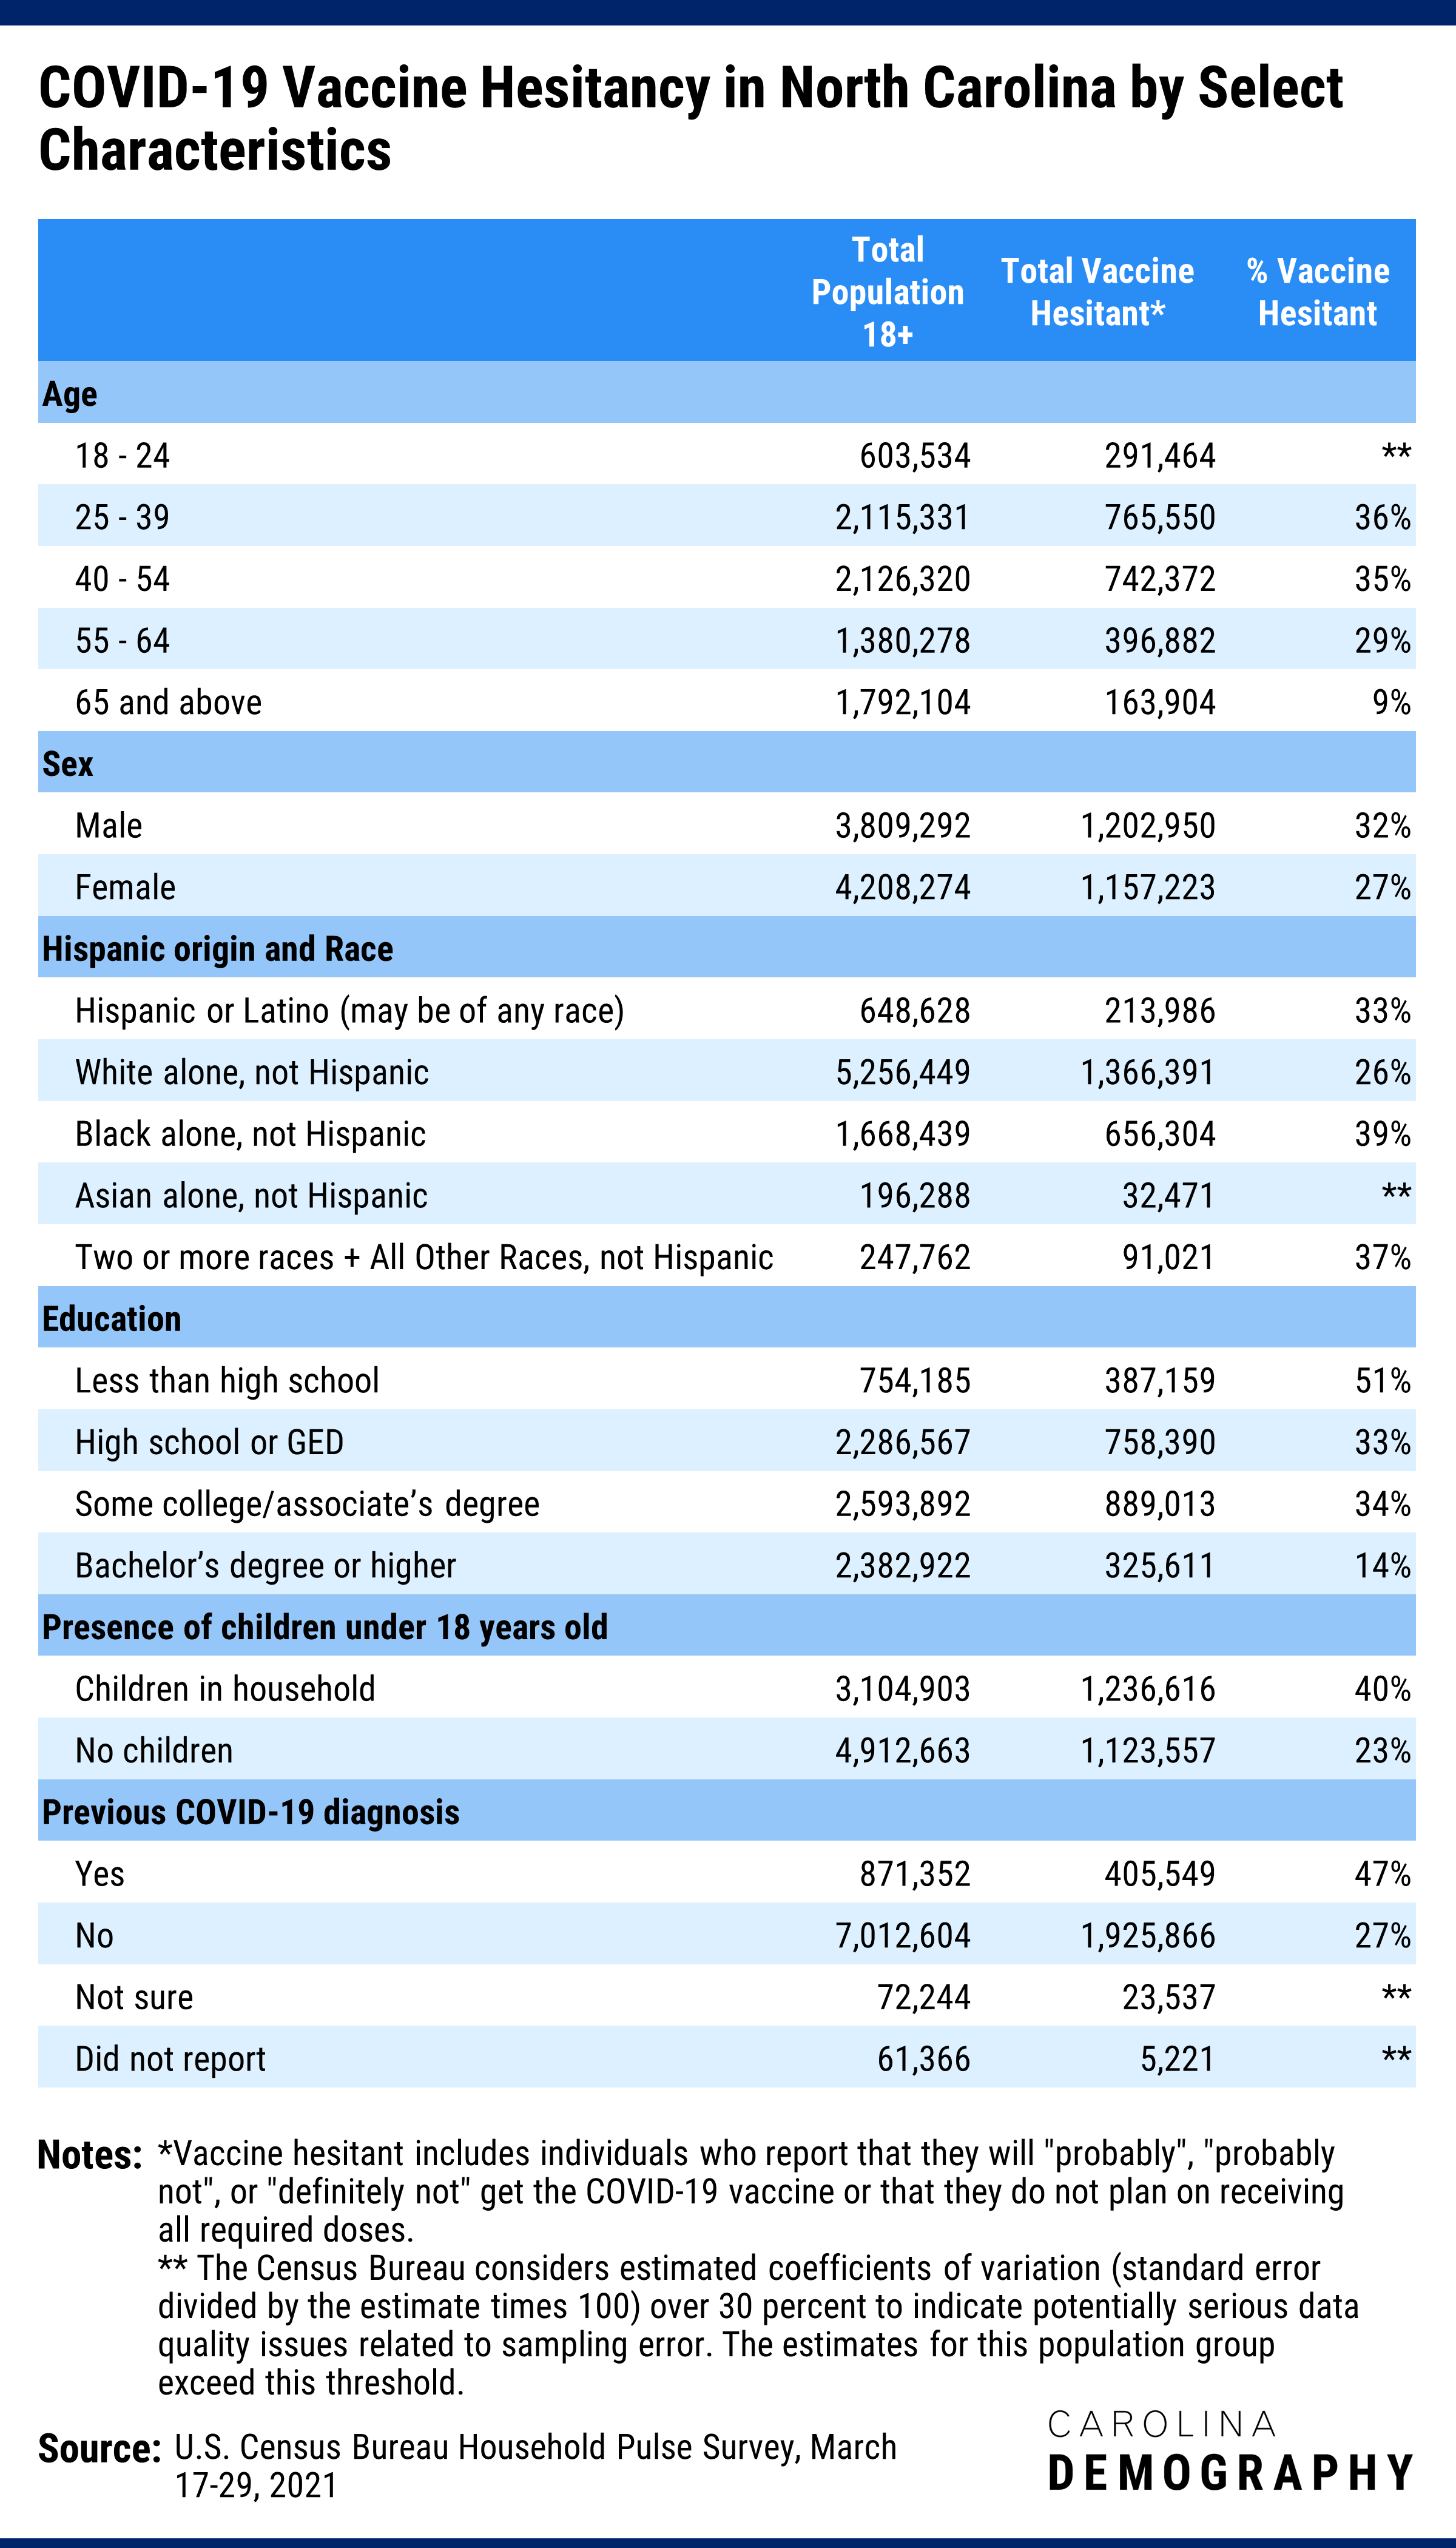
Nearly 2.4 million North Carolina adults reported that they are vaccine hesitant, defined here as meaning that they will either probably, probably not, or definitely not get a vaccine, or that they did not plan on receiving all required doses. This represents 29% of North Carolina’s adult population.
Vaccine hesitancy varies significantly by population group:
Vaccine hesitancy also decreased with educational attainment: 51% of adults with less than a high school diploma reported vaccine hesitancy, compared to 34% of adults with a high school diploma, some college or associate degree and 14% of adults with a bachelor’s degree or higher.
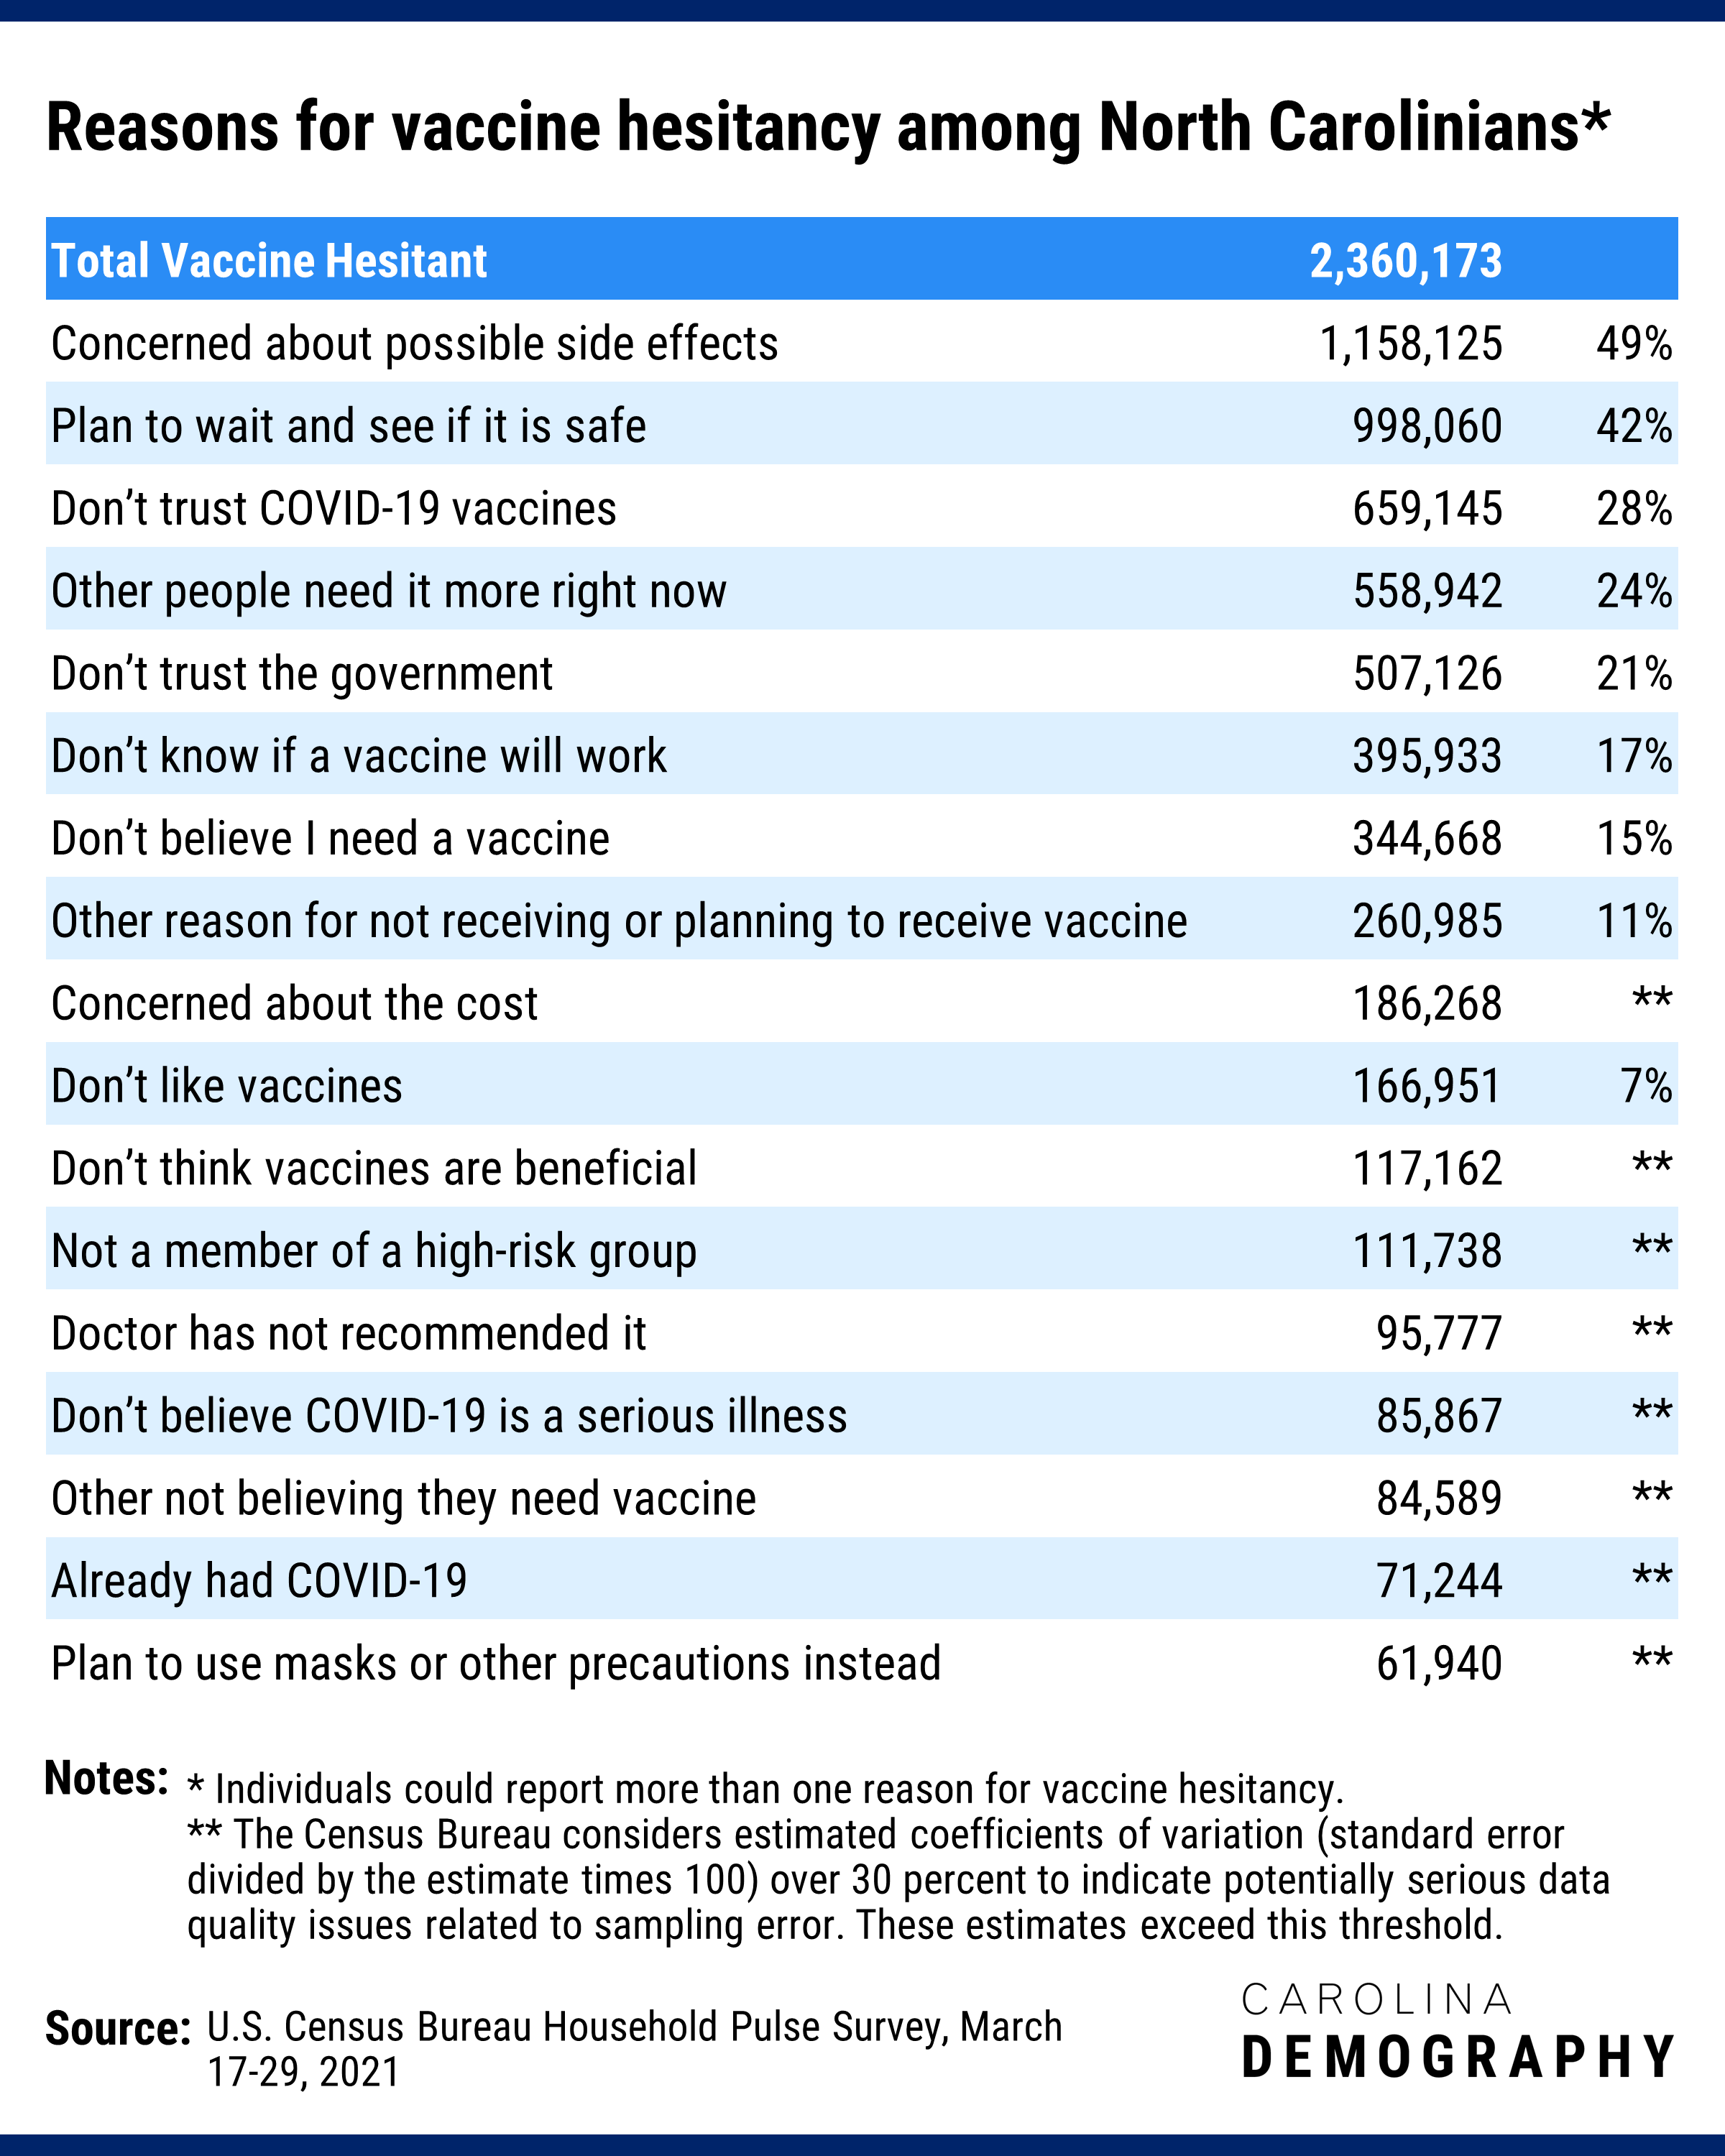
Individuals could report multiple reasons for not receiving or not planning to receive the COVID-19 vaccine. These reasons included:
Concerns about vaccine safety: 49% of vaccine hesitant respondents reported concerns about possible side effects and 42% said they planned to wait and see if it is safe.
Mistrust in the government and vaccines in general. Among vaccine hesitant respondents:
Low sense of personal need: 24% reported that other people need the vaccine more right now and 15% said they did not believe they needed a vaccine.
The most common reason given varied by an individual’s level of hesitancy. Individuals who reported that they would “probably get a vaccine” were most likely to report that they would plan to wait to see if it is safe (57%). Concerns about possible side effects were the most commonly cited reason (54%) among individuals who said they would “probably not” get the vaccine while those who said they would “definitely not” get the vaccine were most likely to say they did not trust COVID-19 vaccines (53%).
The U.S. Census Bureau’s Household Pulse Survey (HPS) is an ongoing survey to track the impacts of the COVID-19 pandemic on the lives of people in the United States. It is an experimental data product that was developed and implemented rapidly to deliver data about pressing issues to policymakers so that they could make decisions quickly.
The HPS represents a collaboration between the U.S. Census Bureau and multiple federal agencies, including the Centers for Disease Control. The HPS began on April 23, 2020 and will continue through December 2021. The questionnaire has changed over time to reflect the evolving pandemic.
Because it is an experimental data product, the HPS data may not meet all the high standards of data quality and statistical reliability of traditional Census Bureau data. In particular, the State Health Access Data Assistance Center (SHADAC), notes that the HPS has relatively low response rates (7-8%) and is an internet-based survey, with individuals invited to participate by email and text message. SHADAC emphasizes that “these issues in particular could be potential sources of bias but come with tradeoffs of increased speed and flexibility in data collection as well as lower costs.”
To help data users, the Bureau releases detailed documentation on the methodology of the Household Pulse Survey and the standard errors of the estimates. In particular, the Census Bureau advises that there are “potentially serious data quality issues related to sampling error” when the coefficient of variation (standard error divided by the estimate) is 30% or more. Based on this guidance, we are only presenting data where the coefficient of variation for the estimate is less than 30%.
Need help understanding population change and its impacts on your community or business? Carolina Demography offers demographic research tailored to your needs.
Contact us today for a free initial consultation.
Contact UsCategories: Health & Environment

The Center for Women’s Health Research (CWHR) at the University of North Carolina School of Medicine released the 12th edition of our North Carolina Women’s Health Report Card on May 9, 2022. This document is a progress report on the…

Dr. Krista Perreira is a health economist who studies disparities in health, education, and economic well-being. In collaboration with the Urban Institute, she recently co-led a study funded by the Kate B. Reynolds Foundation to study barriers to access to…

Our material helped the NC Local News Lab Fund better understand and then prioritize their funding to better serve existing and future grant recipients in North Carolina. The North Carolina Local News Lab Fund was established in 2017 to strengthen…
Your support is critical to our mission of measuring, understanding, and predicting population change and its impact. Donate to Carolina Demography today.