It’s been almost four years since the 2016 general election and in that time, there have been demographic shifts in North Carolina. With just two months before the 2020 election cycle, we’ve broken down the changes by partisan composition and who makes up our newly registered voting population.
North Carolina has experienced steady population gains since 2016, with net gains masking a larger turnover in the underlying population. For example, North Carolina added more than 85,000 new residents from net migration in 2017, with nearly 370,000 individuals moving here from another state or country and roughly 285,000 North Carolinians moving out of state.
A concrete way to understand the potential impact of demographic change on North Carolina’s electorate is to look at new voting registrations since the 2016 general election. This number includes new residents in the state, individuals who became 18+ or gained citizenship since 2016, and prior residents who are registering to vote for the first time.
According to the NC State Board of Elections, there have been nearly 1.8 million voter registration forms filed since the November 8, 2016 general election. These new voters make up 25% of the state’s 7.1 million registered voters.
This spring, many analysts were concerned that the COVID-19 pandemic would hinder voter registration efforts. Data in North Carolina suggested that this was the case: registrations in March were down compared to March 2016 and registrations in April and May were down compared to both 2016 and 2018.
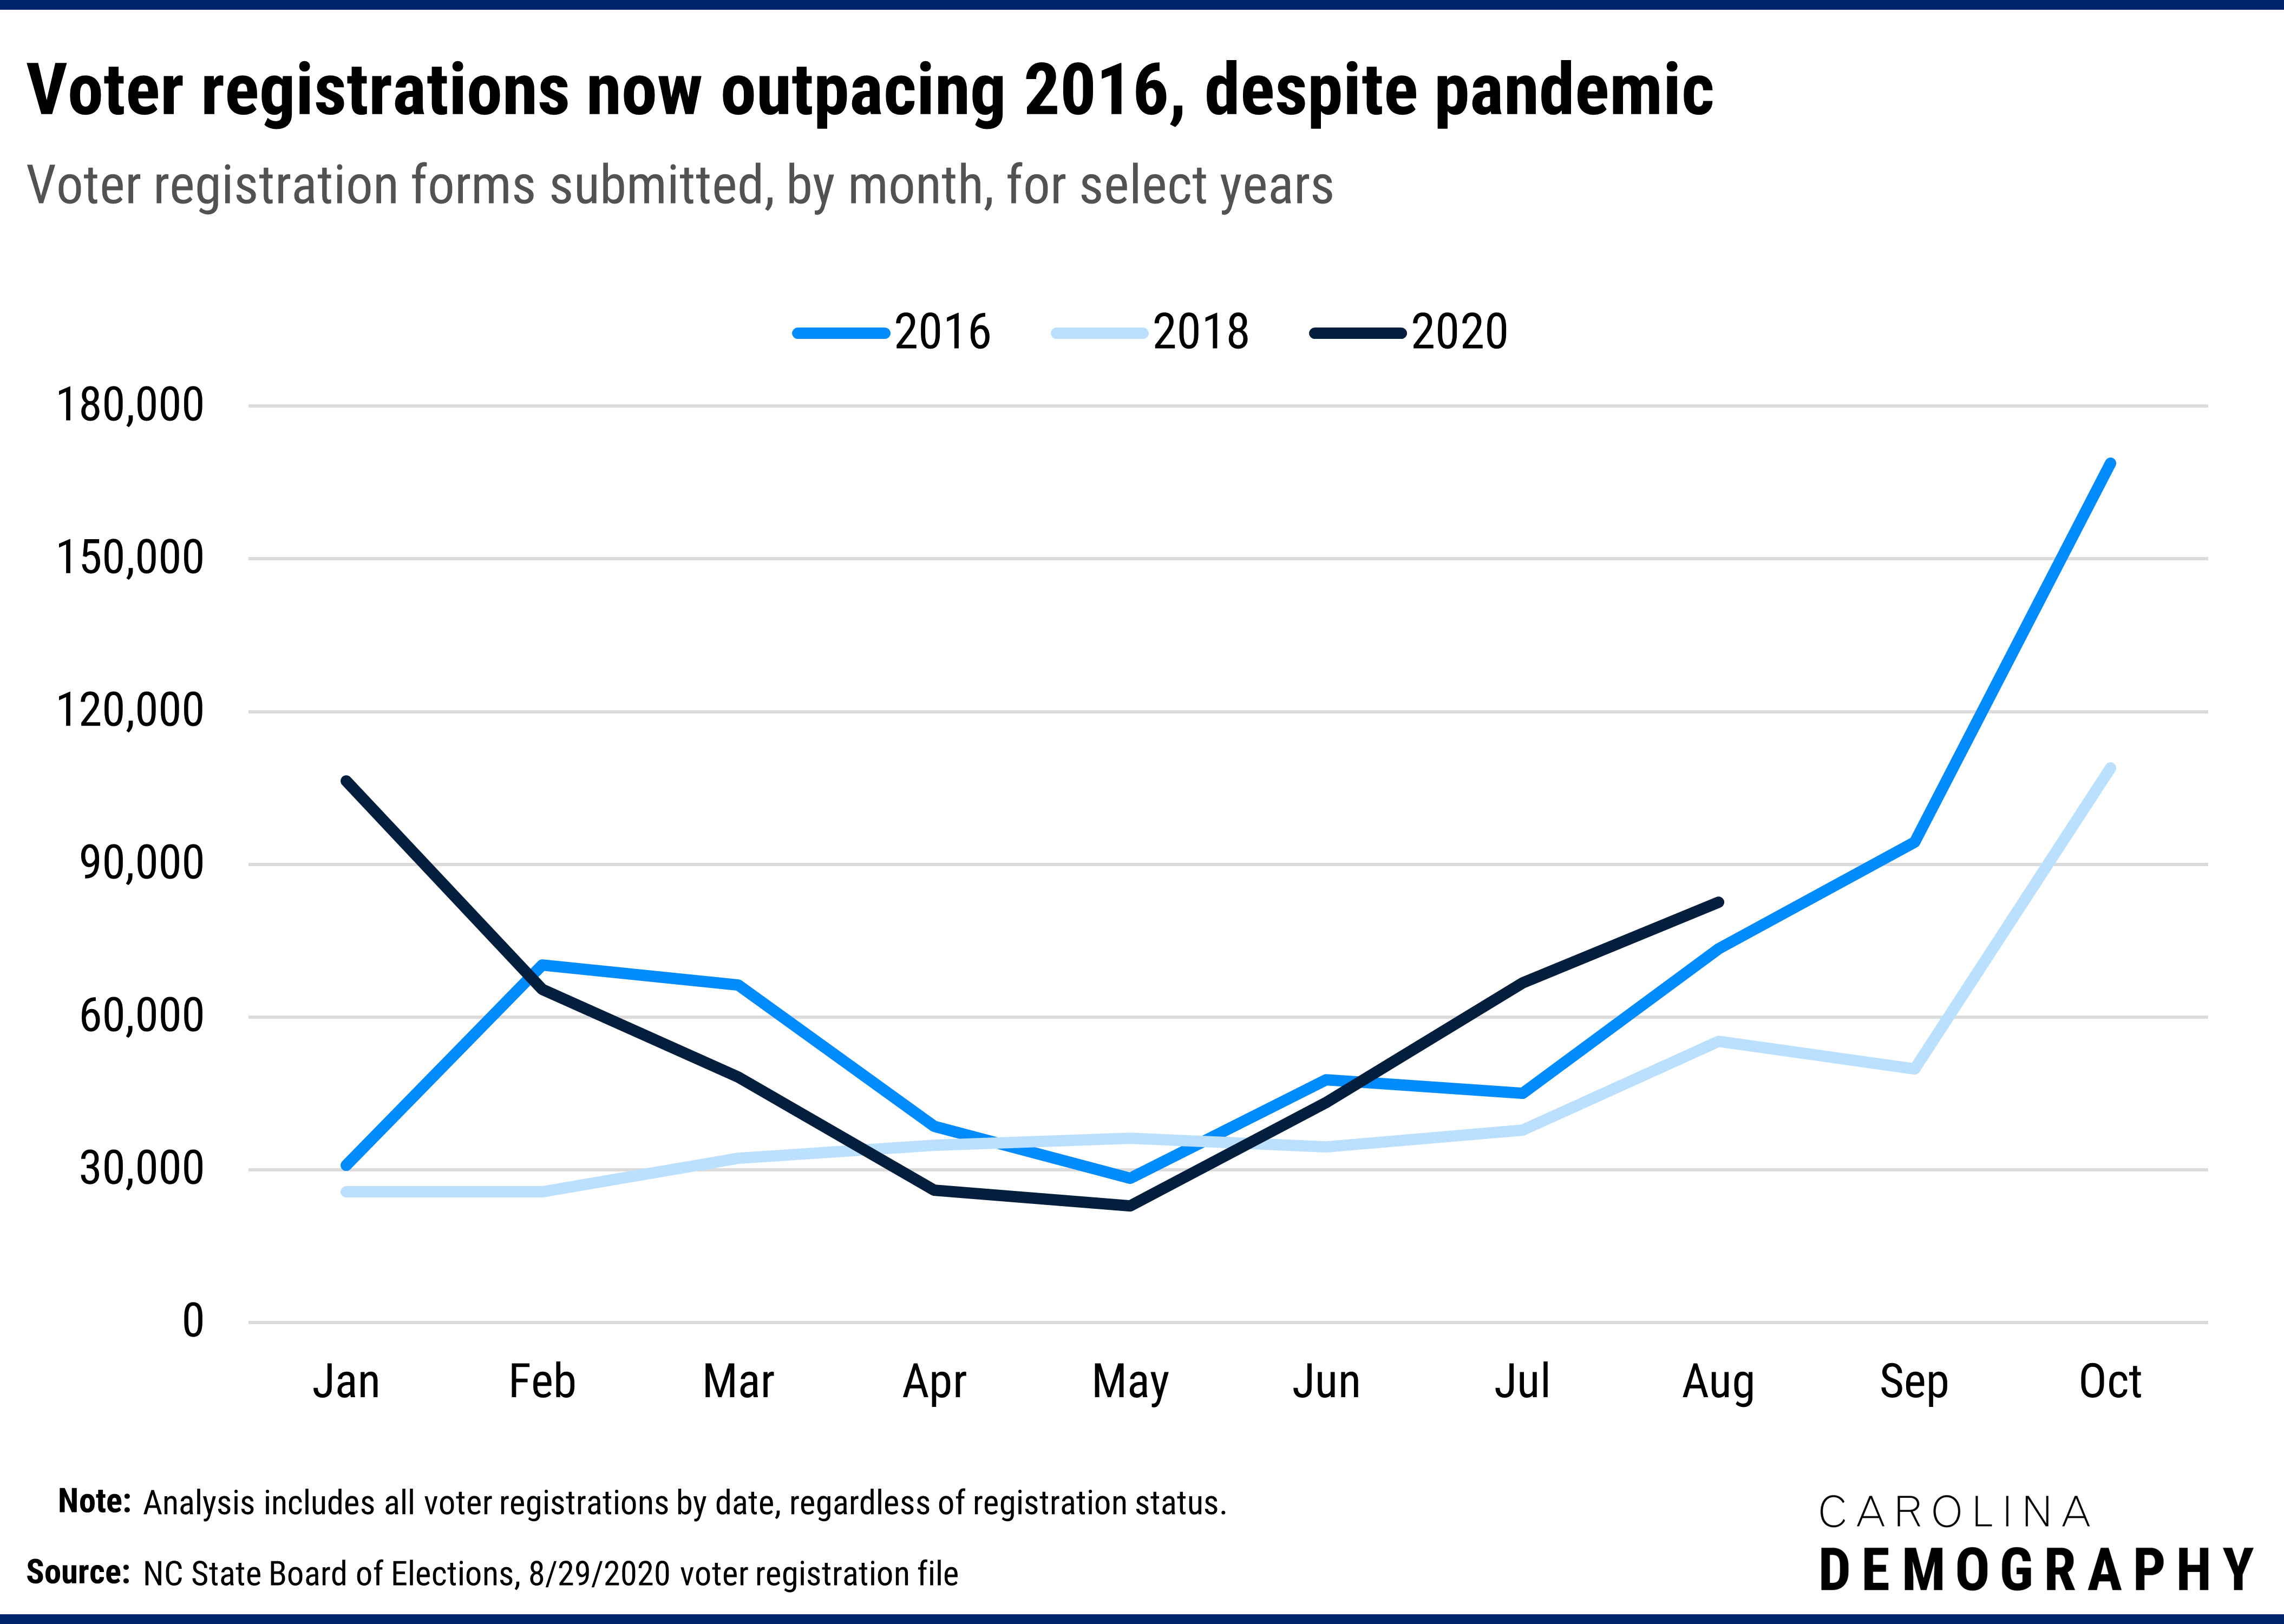
Voter registrations began rebounding in June, however, and July and August registrations have outpaced 2016. Between March and August, the state has received nearly 290,000 voter registrations compared to 299,000 during this same period in 2016. If the pace of registrations continues like the pace seen in 2016, we could see more than 100,000 voter registrations in September and even more in October.
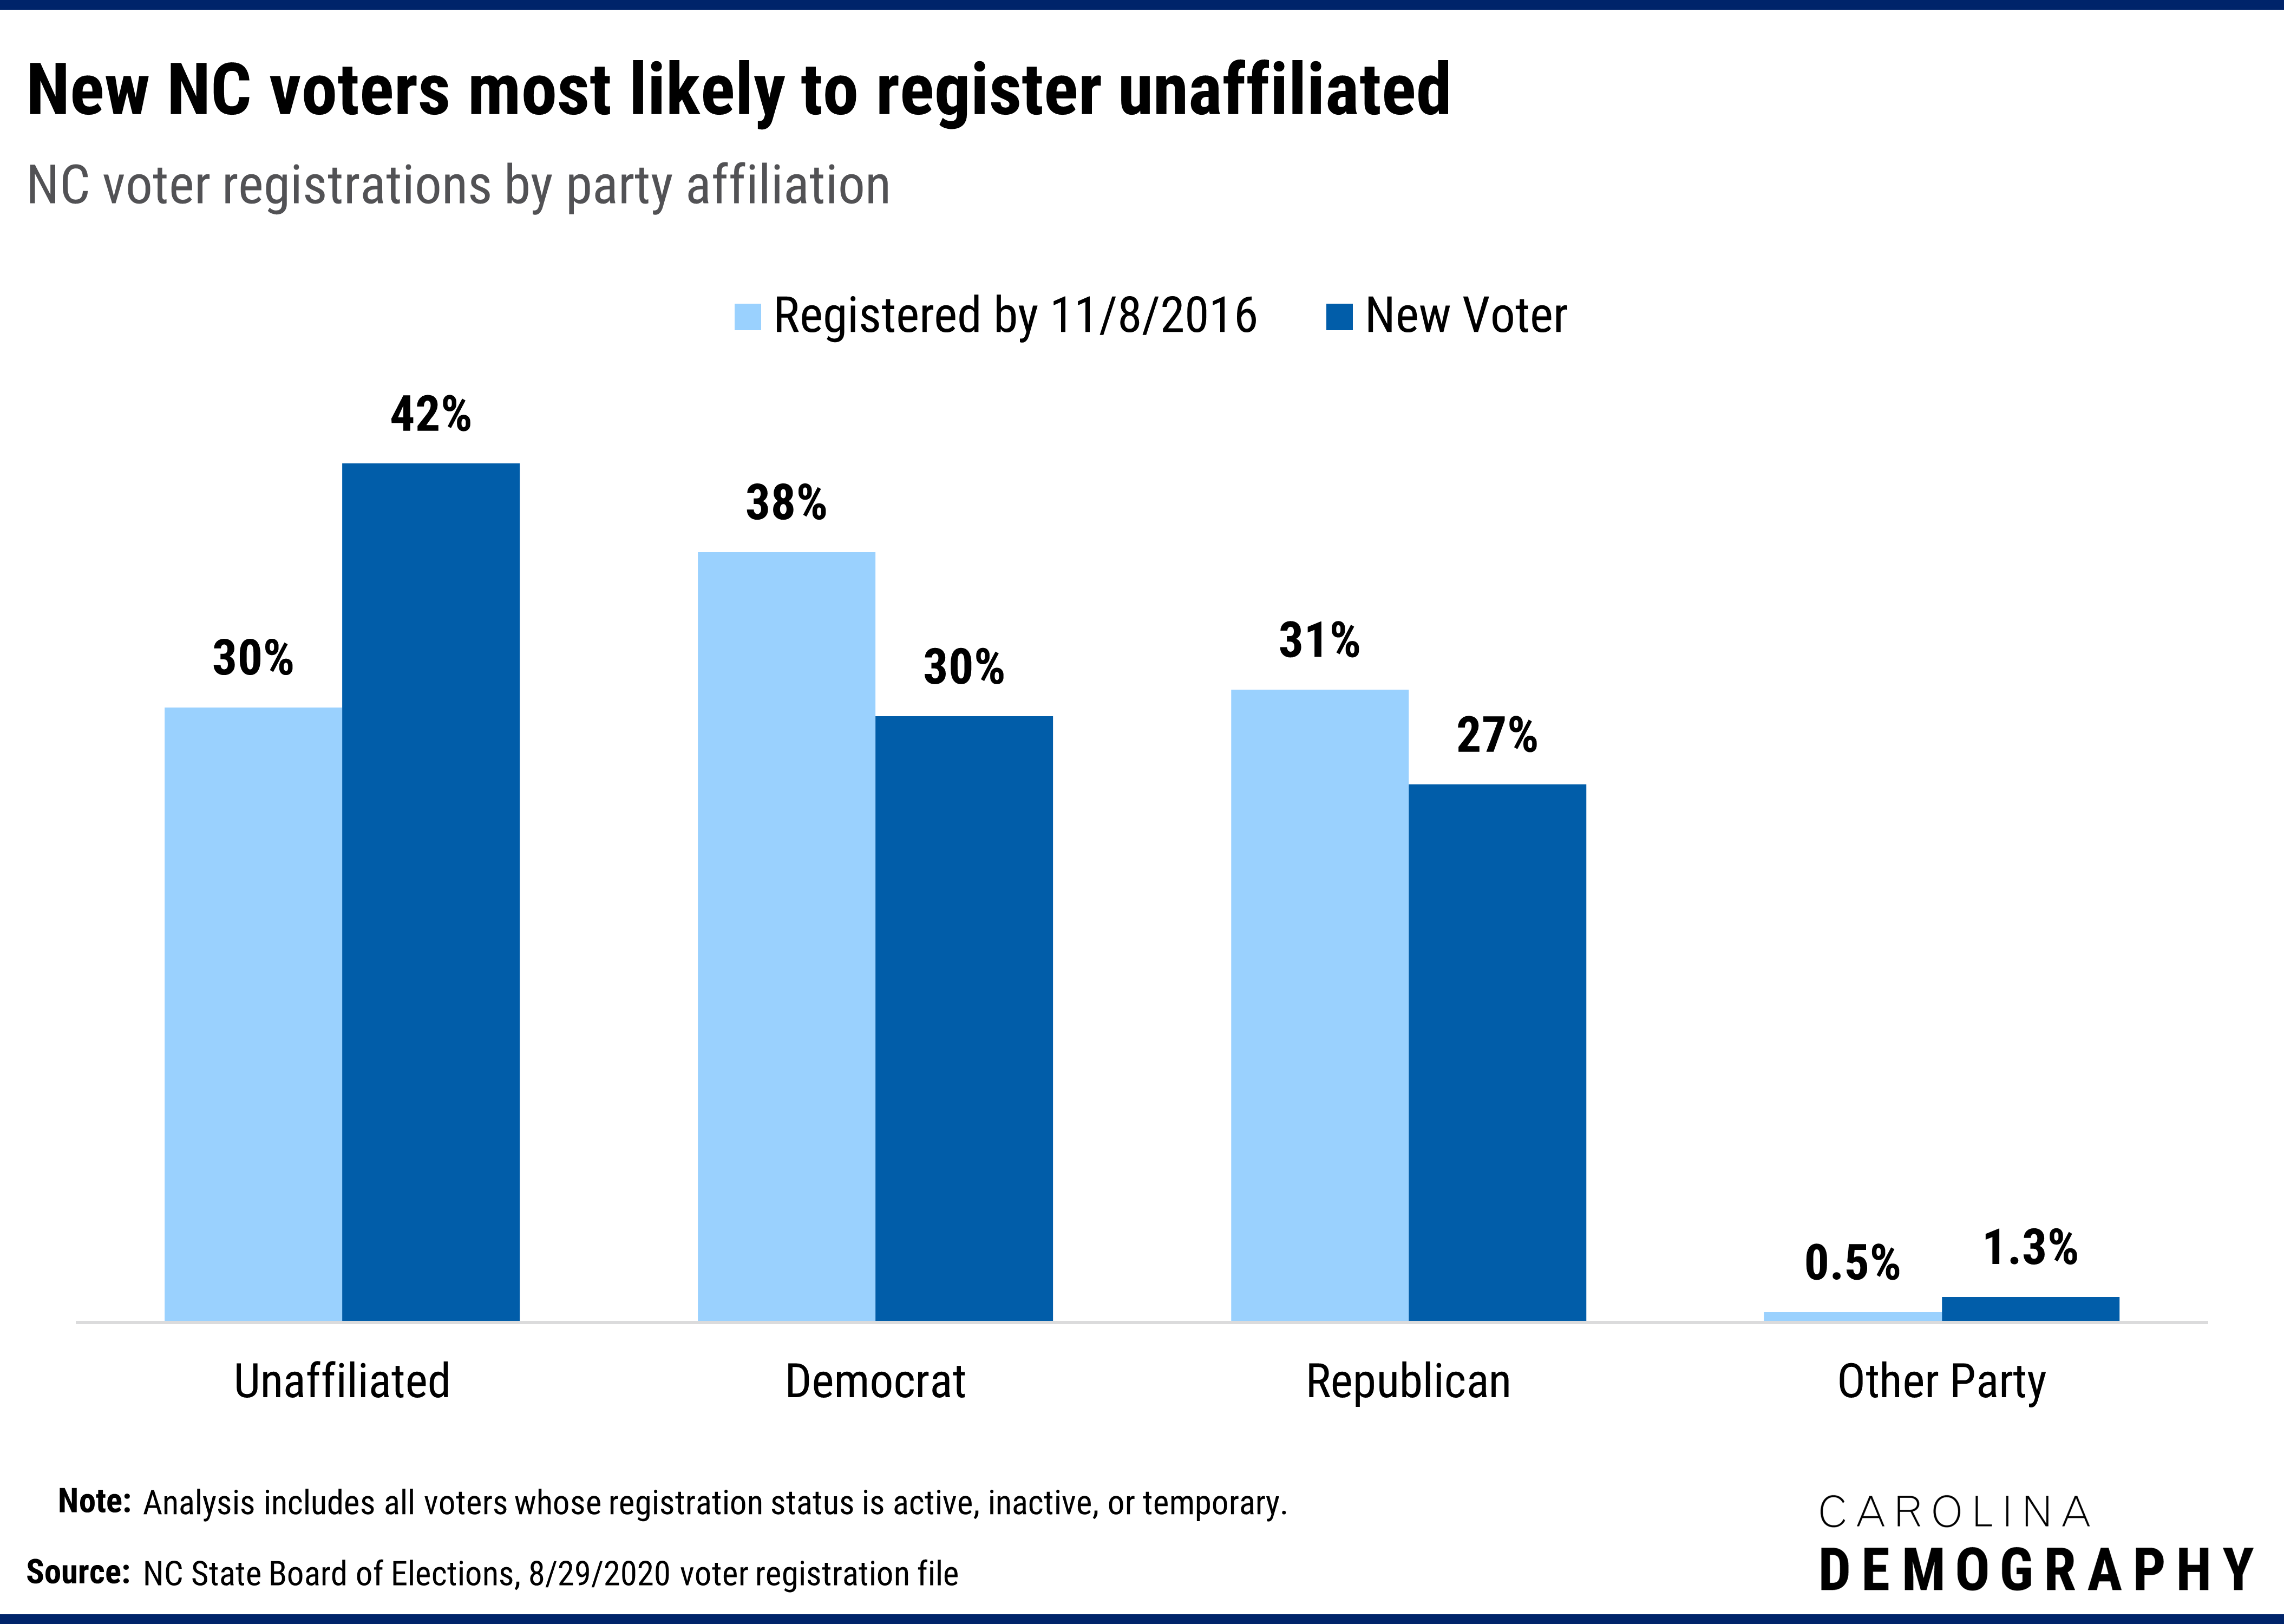
New voter registrations suggest an overall swing away from major parties and towards unaffiliated, with the greatest impact on the Democrat share of registrations. Among new registrants since the 2016 general election:
Nearly one in every three (32%) of unaffiliated voters is a new voter since 2016 compared to 21% of Democrat voters and 22% of Republican voters.
As my colleague Michael Bitzer at Catawba College can show you, unaffiliated or independent voters are rarely truly unaffiliated. These voters tend to lean one way or the other and generally vote with the party of their preference. What these patterns do mean is that it is currently more challenging to predict party affiliation from voter registration data.
Compared to voters who were registered prior to the 2016 general election, newly registered NC voters were more likely to identify as Hispanic (5% vs. 2%) or Asian (2% vs. 1%). Two in every five Hispanic voters is a newly registered voter (compared to one in four overall)
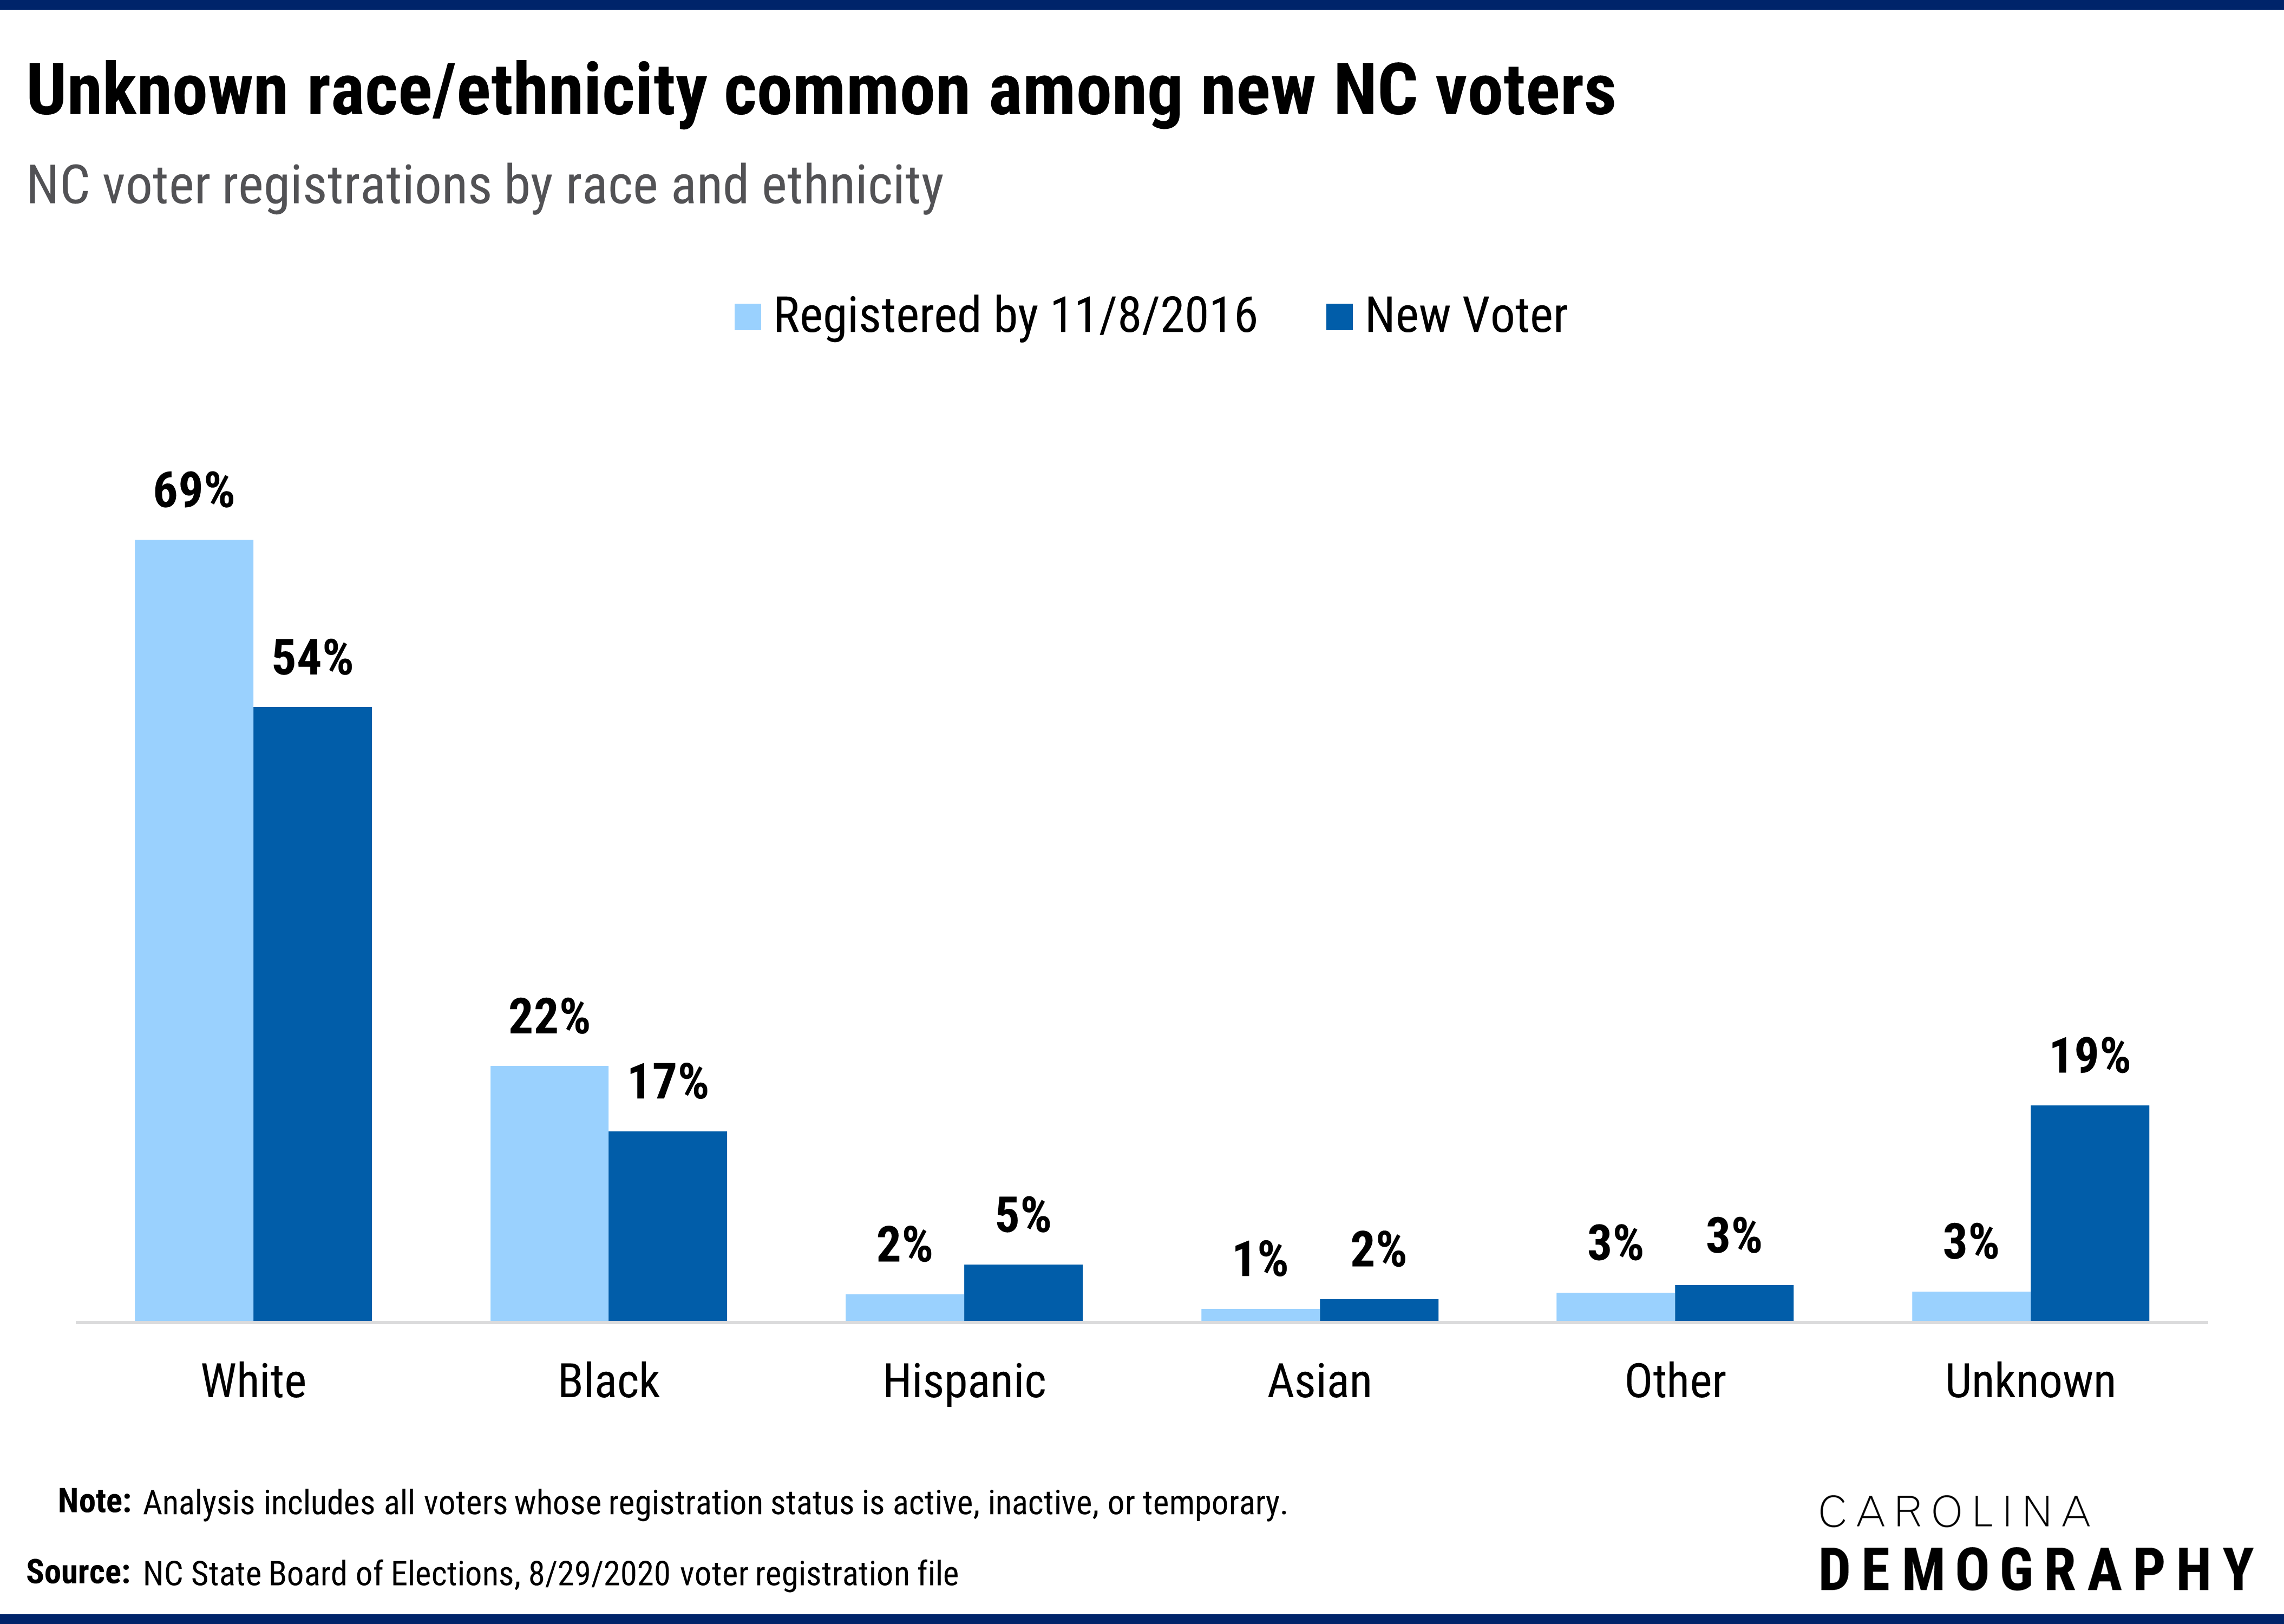
New voters were also much less likely to report their race or ethnicity on the registration form: 19% of new voters did not provide information on their race or ethnicity compared to 3% of voters registered prior to the 2016 election. This share has also been increasing steadily over the past few months, with more than half of voter registrations submitted in July and August reporting “unknown” race and ethnicity, potentially due to increased use of the DMV website to register.
A much larger share of newly registered voters are young voters (42% are under 30 compared to 13% of voters registered for the last election). This is partly because many of these young adults are newly eligible to vote and are registering for the first time, but also because young adults are more likely to move than older adults. Colleges and universities, military bases, and employment opportunities in our state’s metro areas attract many young adults from other states and countries. Among the 802,000 NC registered voters ages 18-24, for example, one-third were registered prior to the 2016 election and two-thirds have registered since then.
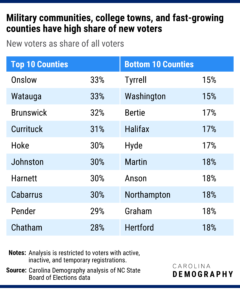
Statewide, 25% of voters have registered since November 8, 2016. In two counties—Onslow (home to Marine Corps base Camp Lejeune) and Watauga (home to Appalachian State University)—one in three voters have registered since the last presidential election. Both military bases and college towns have significant ins and outs, which contributes to high levels of new registrations.
The county with the third highest share of new voters is Brunswick County. Brunswick is the fastest-growing county in the state, growing by an estimated 33% since 2010.
In contrast, counties where new voters are a relatively smaller share of the local electorate are predominantly located in the northeast, though they also include Anson in the Sandhills and Graham in the west. All ten of the counties with the smallest share of new voters have lost population since 2010 according to recent estimates from the U.S. Census Bureau.
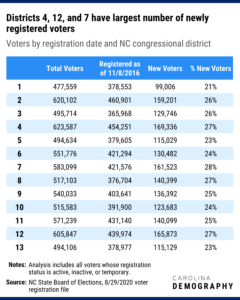
Among North Carolina’s thirteen congressional districts, the largest number of new voters are:
New voters are the largest share of registered voters (28%) in the 7th district.
The 1st district (northeast on the Virginia border from the Triangle to the Inner Banks) has the smallest number of new voters (99,006). New voters are also the smallest share of all registered voters (21%) in the 1st district.
Have questions about NC’s voting population in advance of the 2020 election? Let us know. (Note: while we love to make population projections, we don’t make predictions about election outcomes.)
Note: We used the current voter registrations (as of August 29, 2020) from the NC State Board of Elections. Voters who were reported removed, dead, or having had their registration application denied were excluded from the analysis, unless otherwise noted.
Need help understanding population change and its impacts on your community or business? Carolina Demography offers demographic research tailored to your needs.
Contact us today for a free initial consultation.
Contact UsCategories: Carolina Demographics, Elections & Voting

The Center for Women’s Health Research (CWHR) at the University of North Carolina School of Medicine released the 12th edition of our North Carolina Women’s Health Report Card on May 9, 2022. This document is a progress report on the…

Dr. Krista Perreira is a health economist who studies disparities in health, education, and economic well-being. In collaboration with the Urban Institute, she recently co-led a study funded by the Kate B. Reynolds Foundation to study barriers to access to…

Our material helped the NC Local News Lab Fund better understand and then prioritize their funding to better serve existing and future grant recipients in North Carolina. The North Carolina Local News Lab Fund was established in 2017 to strengthen…
Your support is critical to our mission of measuring, understanding, and predicting population change and its impact. Donate to Carolina Demography today.