
As of August 18, 2020, nearly three in five North Carolina households had responded to the census online, by mail, or by phone (59.8%). This is below the national average of 63.9%. It is also below North Carolina’s self-response rate in 2010 (64.8%) by five percentage points, despite the two-and-a-half additional months of self-response compared to the last census due to coronavirus-related extensions.
Every household that does not self-respond to the Census must be counted during the Non-Response Follow-Up (NRFU) operation. During NRFU, individual census workers go door-to-door to count households who have not responded. The NRFU operation began in North Carolina on August 11 and will continue through September 30, a month shorter than the initial extension.
The Census Bureau has less time to conduct NRFU than prior censuses. Because of this, the Bureau may need to rely more on other mechanisms, like administrative records and statistical imputation, to ensure all Americans are counted, and it will have less time to do these than under normal census years. Increasing self-response rates is the best way for North Carolina to improve the completeness and accuracy of the data collected for the 2020 Census.
Eleven North Carolina counties already have 2020 self-response rates above their final self-response rate from 2010. These include:
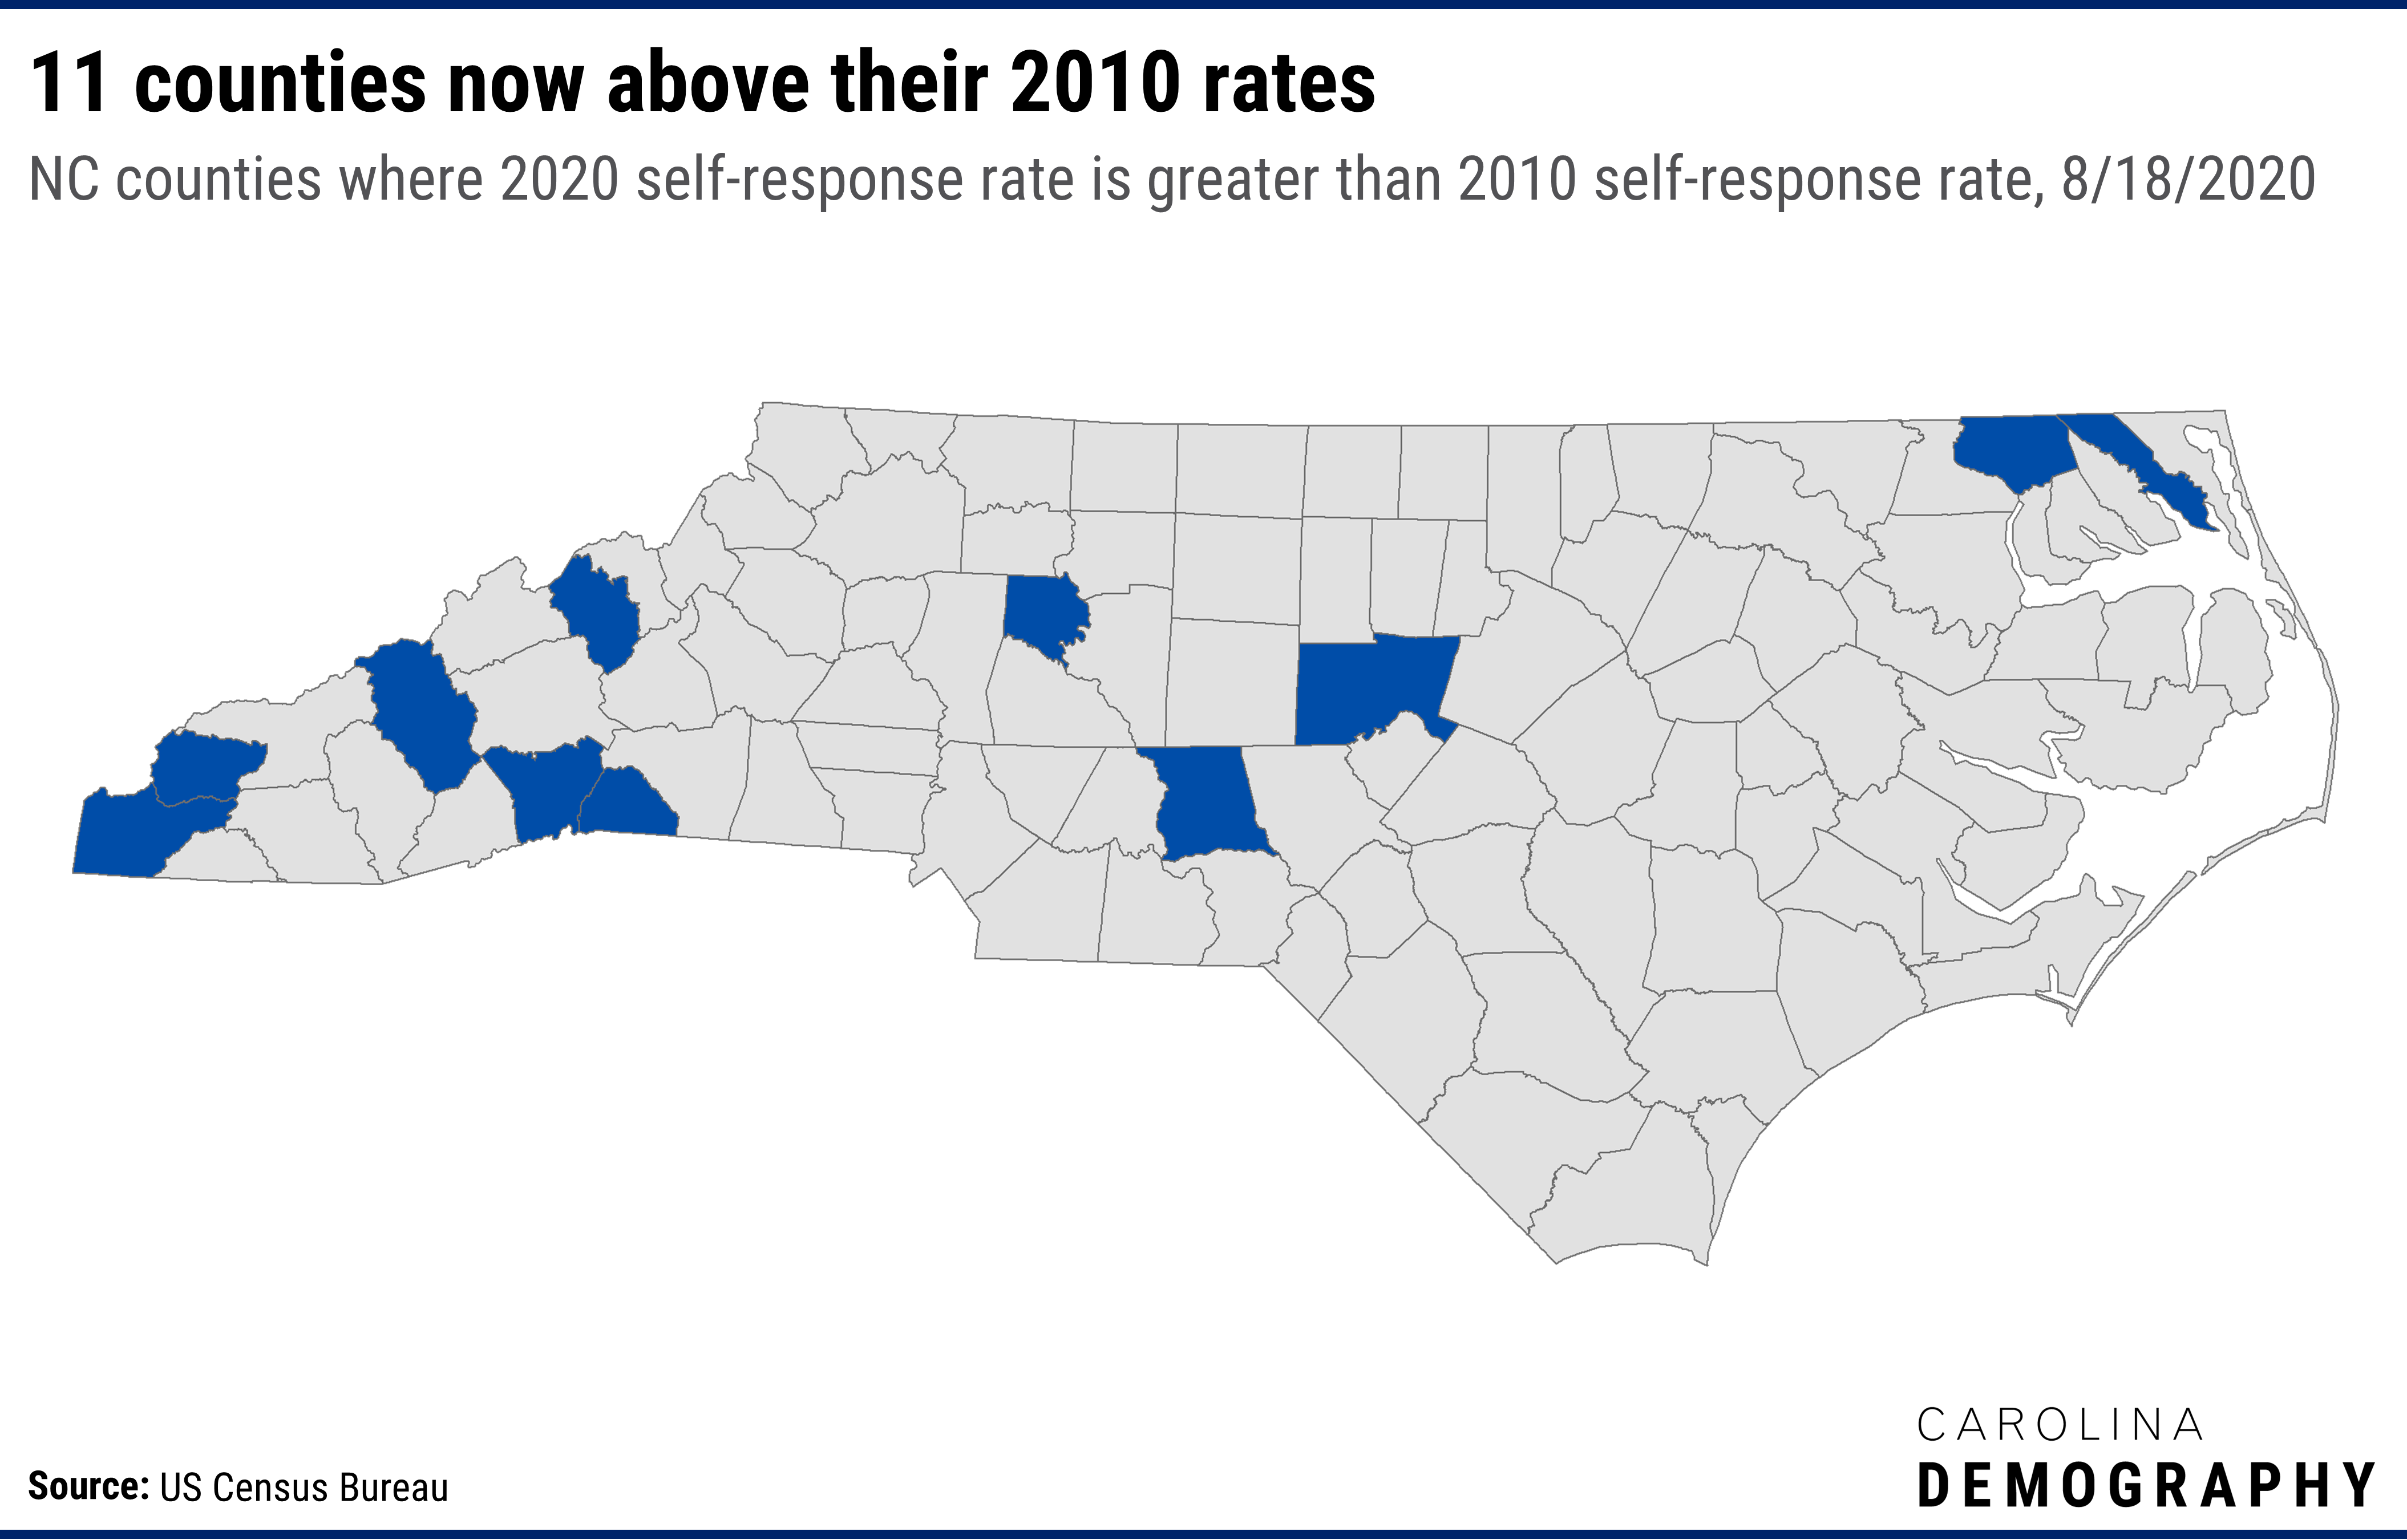
The counties that have already exceeded their 2010 self-response rate include counties with some of the lowest self-response rates (Graham: 31.9% vs. 31.3% in 2010) and the highest (Davie: 68.4% vs. 68.1% in 2010).
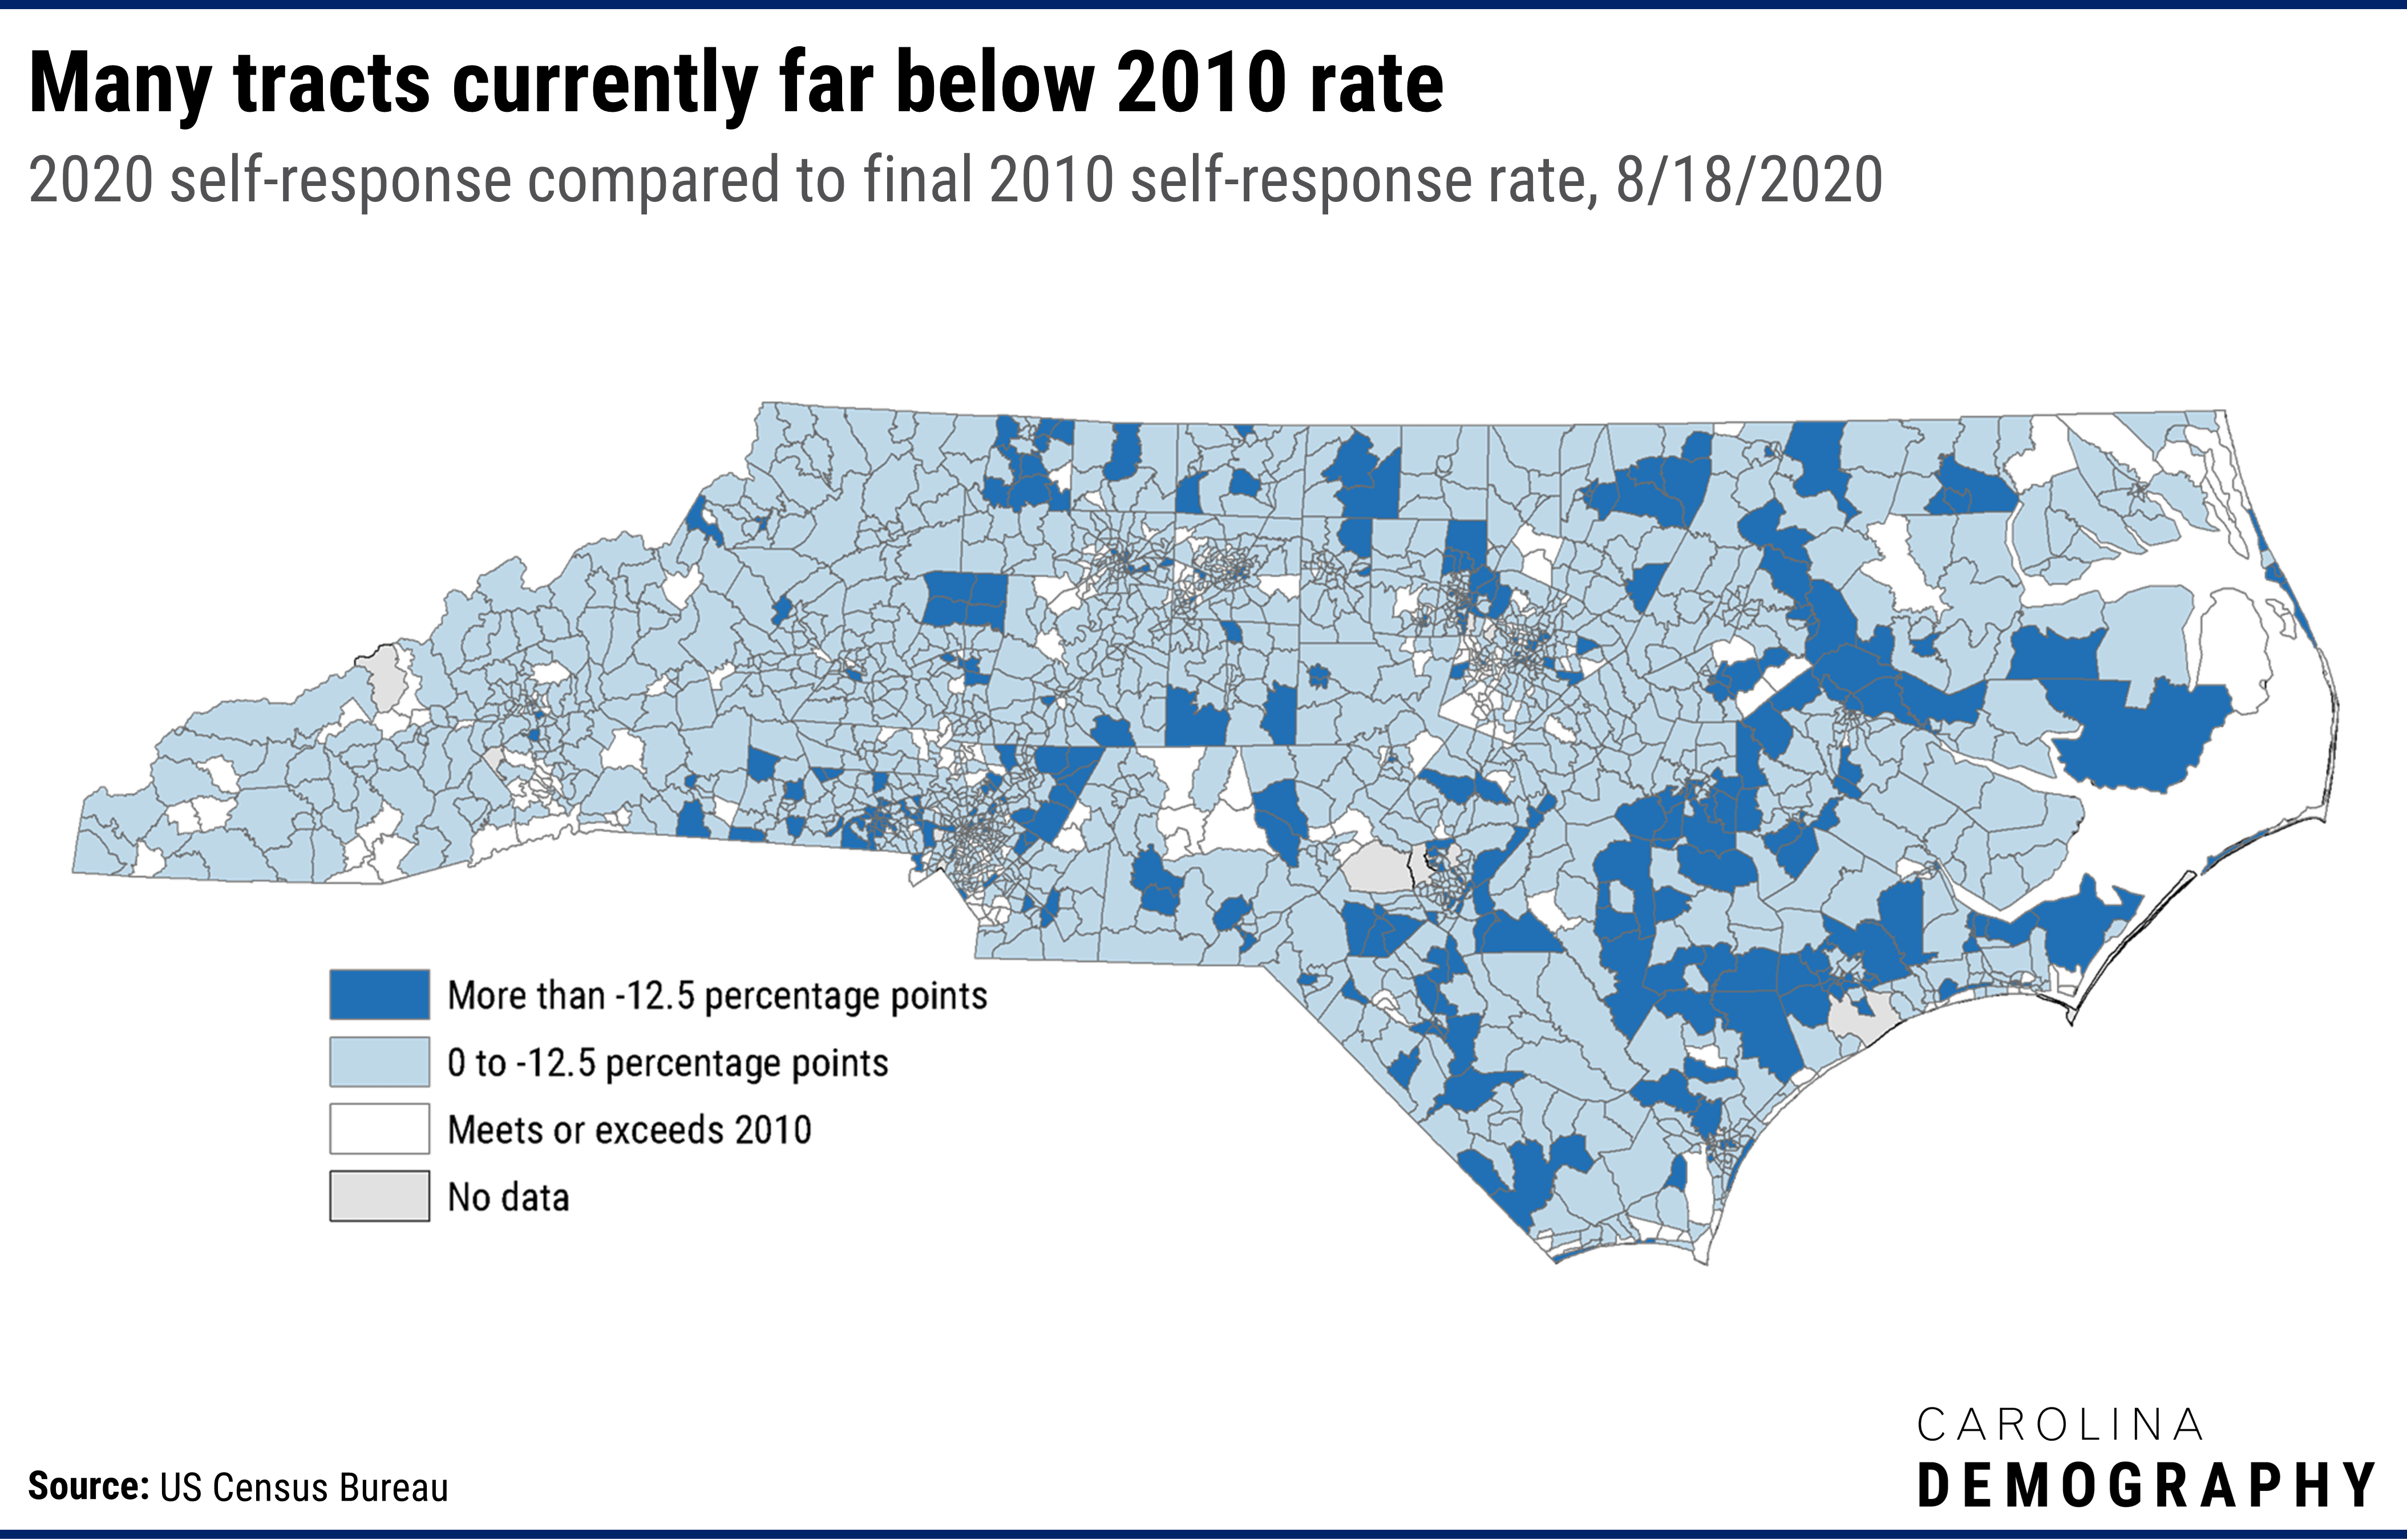
Statewide, there are 2,166 census tracts. Of these, as of August 18th:
The tracts that are furthest behind where they were in 2010—represented by darker blue on the map—represent key opportunities to try to increase self-response rates by September 30th to ensure a complete and accurate count. The highest concentration of these tracts is in eastern North Carolina east of I-95. In six counties, over half of all census tracts fall into this high-risk category: Hyde (100%), Warren (67%), Hertford (60%), Greene (50%), Hoke (50%), and Vance (50%).
There are also significant concentrations of these high-risk tracts in urban areas, with visible clusters around Charlotte, the Triad, the Triangle, and our military communities. The largest number of high-risk tracts are in Gaston County (29), followed by Durham (19), Mecklenburg (18) and Wake (18), Cumberland (17), Forsyth (14) and Onslow (14) counties.
As the Census data collection draws to a close, there is renewed outreach and attention on a complete and accurate count. The Census Bureau sent reminder postcards the week of July 20th, began emailing households in low-responding tracts the week of July 27th, and began a nationwide ad campaign the week of August 10th. In North Carolina, there was messaging to respond to “Avoid the Knock” starting the week of August 3rd and Census workers began showing up in neighborhoods on August 11th.
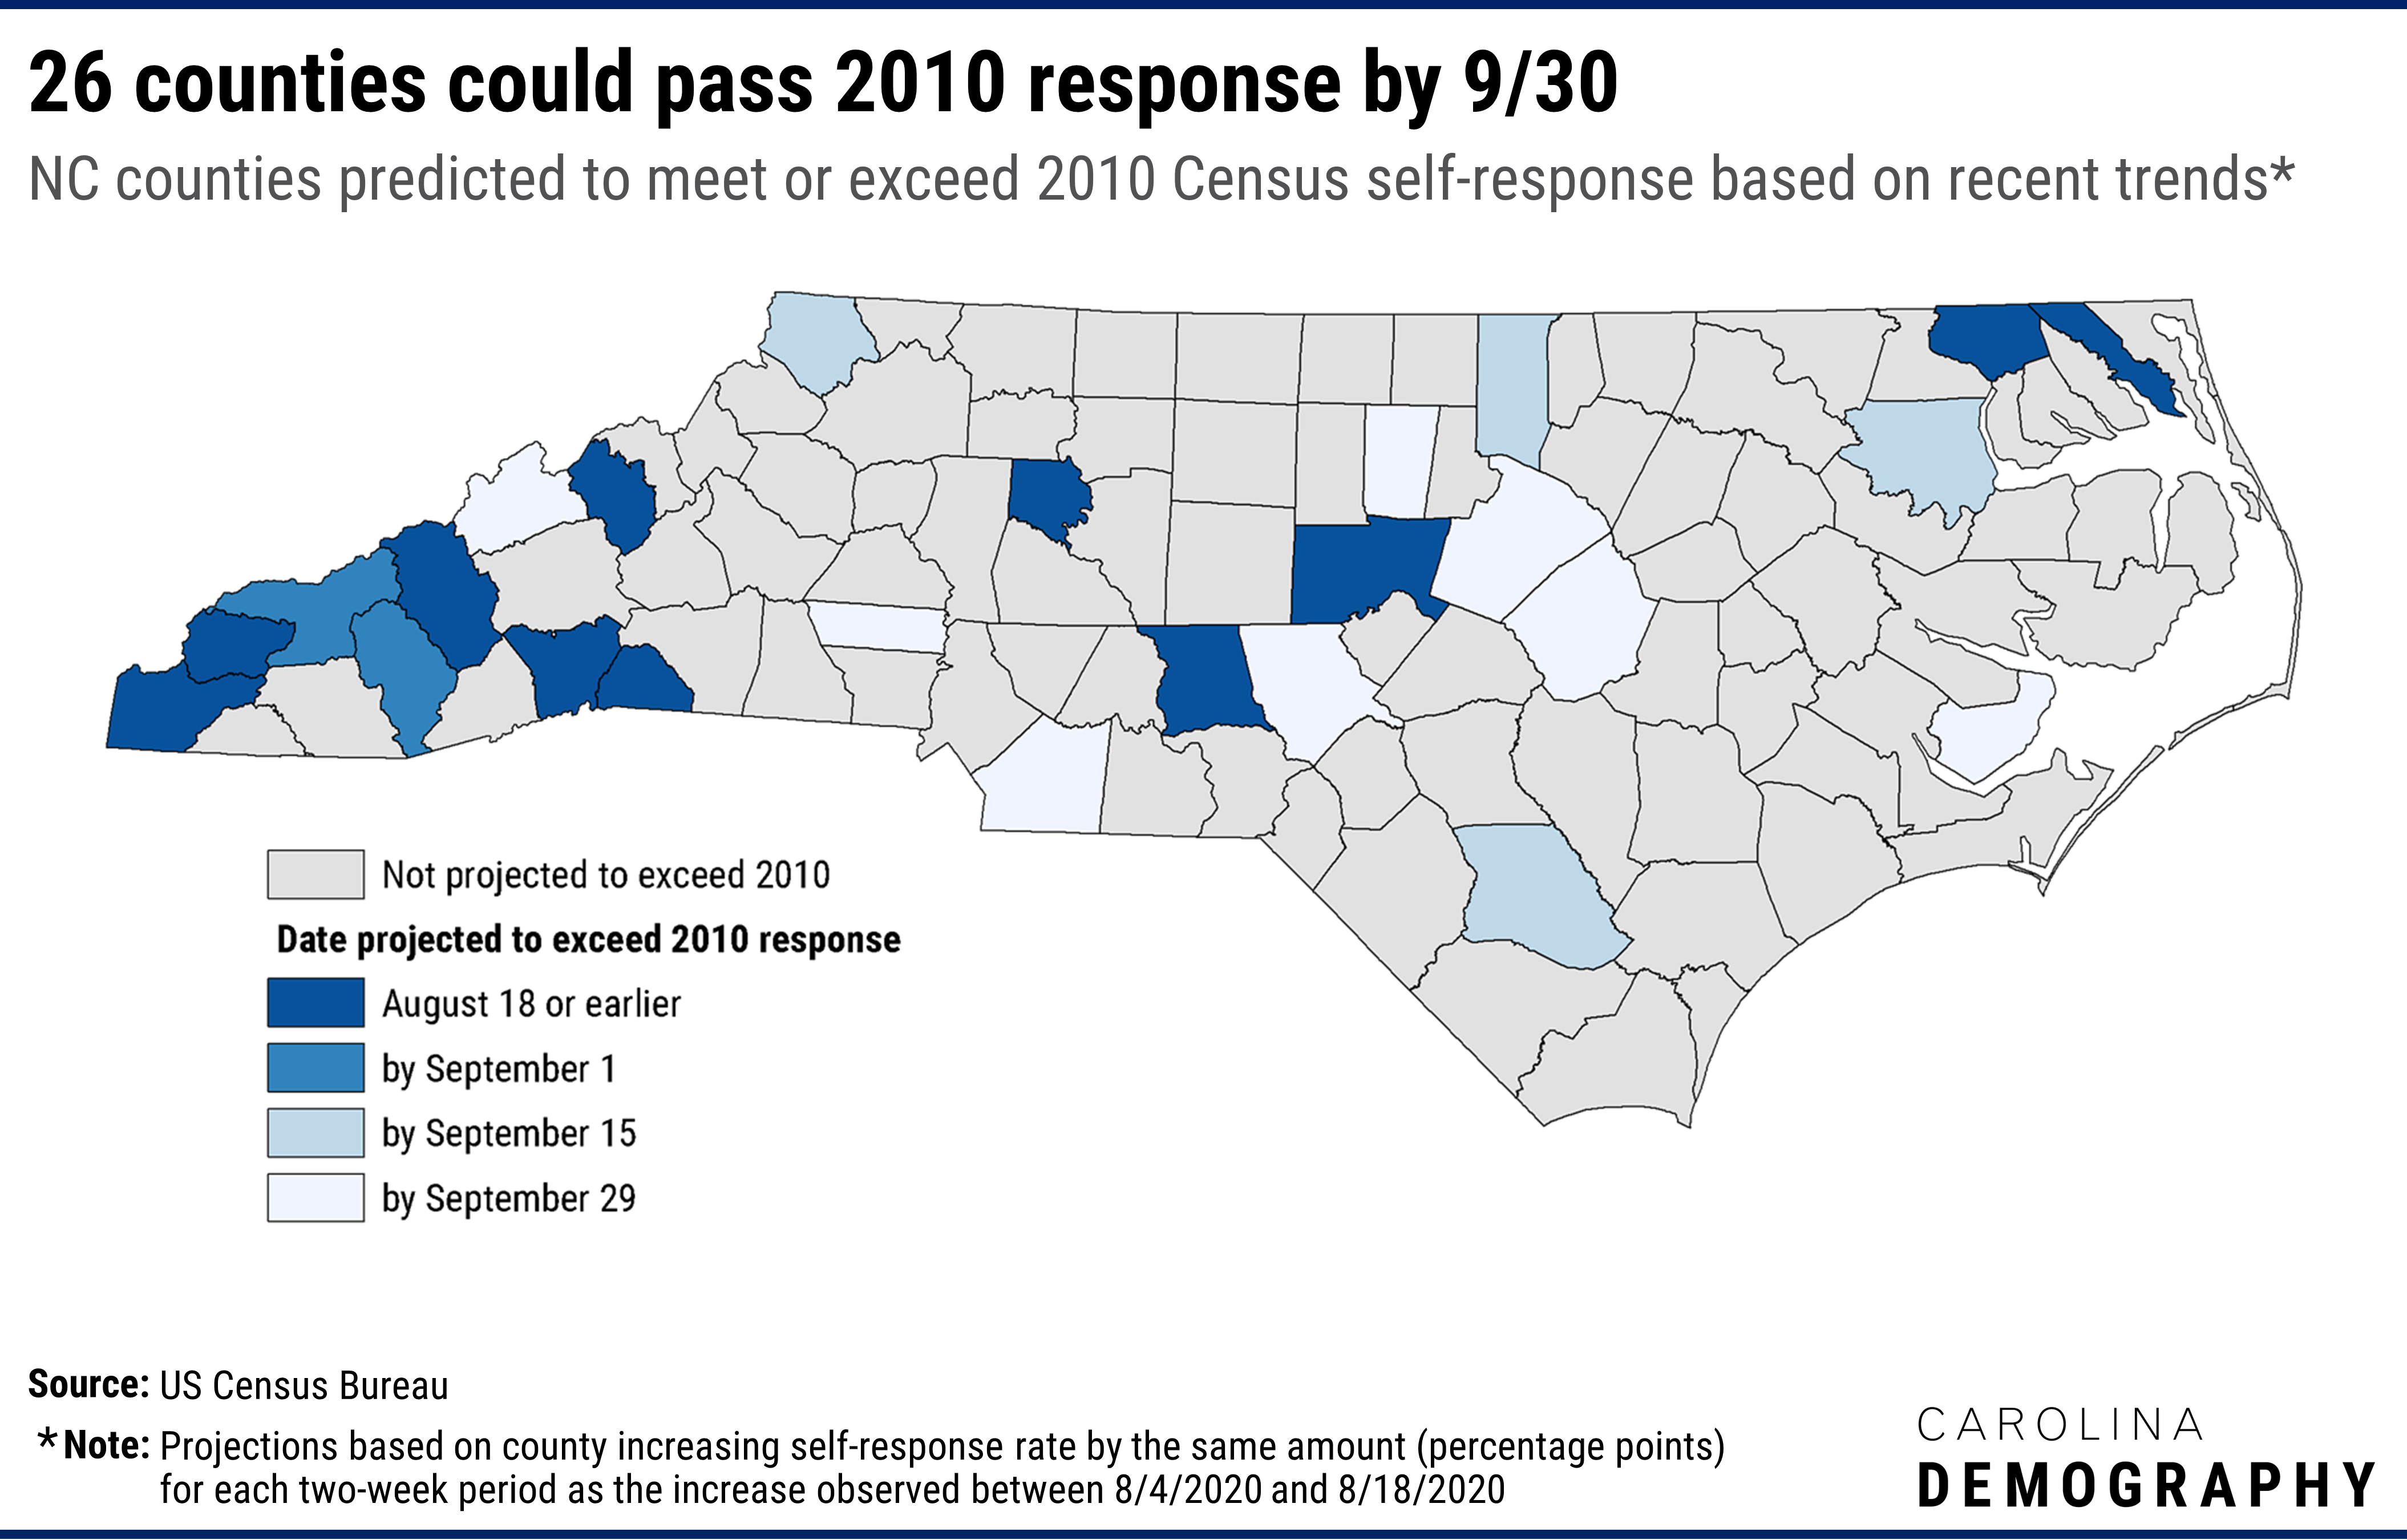
North Carolina’s census response surged during this time, increasing 0.8 percentage points between July 20th and August 4th and another 0.7 percentage points between August 4th and August 18th. This was four times the increases that occurred from late June through mid-July. If the trends observed between 8/4-8/18 continue for each two-week period through September 30th, another 15 counties will meet or exceed their 2010 rates:
Need help understanding population change and its impacts on your community or business? Carolina Demography offers demographic research tailored to your needs.
Contact us today for a free initial consultation.
Contact UsCategories: Carolina Demographics, Census 2020

The Center for Women’s Health Research (CWHR) at the University of North Carolina School of Medicine released the 12th edition of our North Carolina Women’s Health Report Card on May 9, 2022. This document is a progress report on the…

Dr. Krista Perreira is a health economist who studies disparities in health, education, and economic well-being. In collaboration with the Urban Institute, she recently co-led a study funded by the Kate B. Reynolds Foundation to study barriers to access to…

Our material helped the NC Local News Lab Fund better understand and then prioritize their funding to better serve existing and future grant recipients in North Carolina. The North Carolina Local News Lab Fund was established in 2017 to strengthen…
Your support is critical to our mission of measuring, understanding, and predicting population change and its impact. Donate to Carolina Demography today.